- Original Article
- Open access
- Published:
RSDM: A Powerful Direct Method to Predict the Asymptotic Cyclic Behavior of Elastoplastic Structures
Chinese Journal of Mechanical Engineering volume 34, Article number: 140 (2021)
Abstract
Mechanical engineering structures and structural components are often subjected to cyclic thermomechanical loading which stresses their material beyond its elastic limits well inside the inelastic regime. Depending on the level of loading inelastic strains may lead either to failure, due to low cycle fatigue or ratcheting, or to safety, through elastic shakedown. Thus, it is important to estimate the asymptotic stress state of such structures. This state may be determined by cumbersome incremental time-stepping calculations. Direct methods, alternatively, have big computational advantages as they focus on the characteristics of these states and try to establish them, in a direct way, right from the beginning of the calculations. Among the very few such general-purpose direct methods, a powerful direct method which has been called RSDM has appeared in the literature. The method may directly predict any asymptotic state when the exact time history of the loading is known. The advantage of the method is due to the fact that it addresses the physics of the asymptotic cycle and exploits the cyclic nature of its expected residual stress distribution. Based on RSDM a method for the shakedown analysis of structures, called RSDM-S has also been developed. Despite most direct methods for shakedown, RSDM-S does not need an optimization algorithm for its implementation. Both RSDM and RSDM-S may be implemented in any Finite Element Code. A thorough review of both these methods, together with examples of implementation are presented herein.
1 Introduction
Variable thermomechanical loading is an often source of distress for mechanical engineering structures like pressure vessels, aircraft propulsion engines, mechanical machinery parts, etc. Normally these structures and structural members are designed elastically. However, to increase their efficiency they are often required to operate under excessive amount of loading, which may bring them well beyond their elastic limit. Thus, it is important to know their long-term structural behavior and the factor of safety against phenomena like low cycle fatigue or ratcheting, or even shakedown. Such asymptotic states always exist for stable Druckerian type [1] structural materials. If the exact time history of the loading is known, this state can be reached through evolution type incremental step by step finite element (FE) calculations. However, such approaches are very time consuming and often numerically unstable.
A much better alternative having big computational advantages is the use of Direct Methods. These methods seek the asymptotic state right from the start of the calculations. On the other hand, if the exact time history of the loads is not known, but only their limits, as often is the case, direct methods offer the only alternative.
A typical example of these methods is the shakedown analysis, where one seeks to provide limits for a safe state, like shakedown. The search for this state is normally based on the lower bound [2] or upper bound [3] shakedown theorems of plasticity. Most of the numerical approaches are formulated as mathematical programming (MP) problems, which seek to find the maximum or the minimum value of an objective function (normally the loading factor) which is subjected to various constraints either static or kinematic. Linearization of the yield surface has led to solutions using linear programming algorithms, (e.g., a pioneering work [4]). When the constraints are not linearized, the problem is formulated as a non-linear programming problem (e.g., some recent work [5]). Also because of the large number of finite elements used for structural discretization and the big number of constraints, large size optimization problems have to be solved. This led to special numerical techniques like the reduced basis (e.g., Ref. [6]) or Newton like iterations (e.g., Ref. [7]) algorithms. With the advent of computers and the evolution of the interior point methods (IPM) the limit and shakedown large optimization problems are solved till nowadays with the use of these algorithms or related techniques (e.g., Refs. [8,9,10,11,12,13,14]).
Except for the formulation using MP algorithms, other numerical approaches have appeared in the literature. The Linear Matching Method (LMM) was originally used to supply shakedown and plastic collapse limits [15]. It is an iterative procedure that matches a linear problem to a plasticity problem. The approach converges to the shakedown load through a sequence of linear solutions with a spatially varied module. It has been extended beyond shakedown to provide ratchet boundaries for structures subjected to thermomechanical loads [16, 17]. The loading was assumed to be composed of a constant primary load plus a secondary fluctuating load. Thus, numerical solutions were obtained for a Bree type problem, where a constant mechanical load acts together with a cyclic thermal load [18]. Similar assumptions of splitting the load in a constant and a cyclic part were also used for a lower bound solution [19]. In Ref. [20] a simplified approach was presented to estimate the ratchet boundary. It was based on the fictitious yield surface that had been suggested in Ref. [21].
LMM has been extended to find the ratchet boundaries [22] for simultaneous cyclic variation of both thermal and mechanical loads. Quite recently an algorithm that uses successive direct asymptotic solutions to estimate the ratchet boundary was proposed in Ref. [23].
Apart for the determination of various limits, it is important to have direct methods that would determine the long-term effects on a structure of a loading with a given time history. A direct method that addresses this problem is the Direct Cyclic Analysis (DCA) [24] procedure which has been implemented in the Abaqus software [25]. The method is based on the assumption that the displacements at the asymptotic cycle will become cyclic. It is a quite involved combination of an incremental-iterative procedure that gives good results for the case of alternating plasticity, but fails to converge for close to ratcheting loadings. Another direct incremental-iterative procedure based on employing plastic strain increments was proposed in Ref. [26].
The Residual Stress Decomposition Method (RSDM) [27] is a general-purpose direct method that may be used to estimate what kind of asymptotic cyclic state an elastoplastic structure would develop, when subjected to a given cyclic loading. It was originally conceived [28] to estimate the cyclic steady state of creeping structures. The versatility of the approach comes from physical arguments as it takes advantage of the expected cyclic nature of the residual stress distribution in the asymptotic state. Thus, the residual stresses are decomposed in Fourier series over a loading cycle. The coefficients of these series are found in an iterative way with the help of the residual stress time derivative, which is evaluated, at time points inside the cycle, by satisfying equilibrium and compatibility. Based on the RSDM, another method, called RSDM-S, was developed to establish shakedown limits [29]. Applications of the two approaches for two or three thermomechanical loads have been presented in Refs. [30,31,32]. In Ref. [32], the RSDM-S was also extended to multi-dimensional loading domains. Some first results for extending the method to applied displacement loadings may be found in Ref. [33].
In the present paper, a review of the RSDM and its modified version for shakedown, RSDM-S, will be thoroughly exposed. Recent advances from the theoretical and numerical point of view will also be discussed.
A mixture of old and new results is presented, which demonstrate the robustness and numerical efficiency of the two methods.
2 Cyclic Asymptotic Stress States
Let us consider a body of volume V and surface S (Figure 1). A cyclic loading of the form of Eq. (1) is applied on one part of S, whereas the rest is under zero displacement conditions:
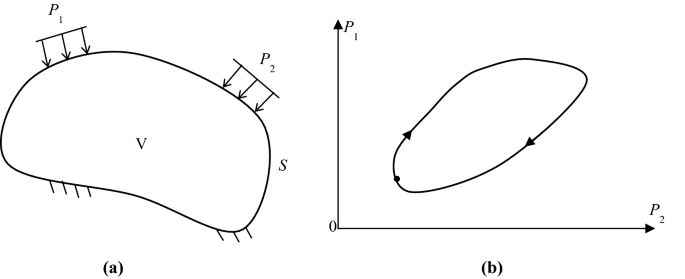
(a) Applied loading, (b) cyclic loading
where P(t) is the set of loads that act on S; t is a time point, T is the period of the cycle, n=1,2,…, denotes the number of cycles. Bold letters are used, herein, to denote vectors and matrices.
In Figure 1, for example, one may see a set of two loads whose cyclic nature in the loading domain is shown in Figure 1(b).
Let us suppose that our structure is made of an elastic-perfectly plastic material. At any time point τ=t/T inside the cycle, the structure will develop a stress field \({\varvec{\sigma}}(\tau )\) which may be decomposed into an elastic part \({\varvec{\sigma}}^{el} (\tau )\), equilibrating the external loading P(τ), assuming a completely elastic behavior, and a self-equilibrating residual stress part \({\varvec{\rho}}(\tau )\) due to inelasticity. Therefore:
An analogous decomposition holds for the strain rates:
The residual strain rate itself may be decomposed into an elastic and a plastic part [21]. Thus, one may write:
It has to be noted that the residual strain rate \(\dot{\user2{\varepsilon }}_{r}^{{}}\), as being the difference of two compatible strain rates \({\dot{\mathbf{\varepsilon }}}\)(true strain rate) and \(\dot{\user2{e}}^{el}\)(solution assuming completely elastic behavior) is itself a compatible strain rate.
The elastic strain rates are related to the stress rates through the elasticity matrix D, whereas the plastic strain rate vector through the gradient to the flow rule:
where f is the yield surface.
Drucker’s stability postulate for rheonomic or scleronomic materials states that for two different stress states and their corresponding plastic strains the following inequalities hold:
Based on this postulate it may be proved [34] that there always exists an asymptotic cyclic state that the stresses and strain rates stabilize and become periodic with the same period of the cyclic loading.
Depending on the amplitude of the load, three different asymptotic states shown, in one-dimension, by stress-strain cycles in Figure 2, may be realized, based on the existence or not of the plastic strain rates.

(a) Elastic shakedown, (b) alternating plasticity, (c) ratcheting
Thus, for elastic shakedown, which is a safe state, \(\dot{\user2{\varepsilon }}^{pl} \to {\mathbf{0}}\). For the case of alternating plasticity (or plastic shakedown) \(\dot{\user2{\varepsilon }}^{pl} \ne {\mathbf{0}},\) but \(\Delta \dot{\user2{\varepsilon }}^{pl} = \int_{0}^{1} {\dot{\user2{\varepsilon }}^{pl} \text{d}\tau } = {\mathbf{0}}\) the structure could fail by local fracture (low cycle fatigue). Alternatively, there could be cases where \(\dot{\user2{\varepsilon }}^{pl} \ne {\mathbf{0}},\) and \(\int_{0}^{1} {\dot{\user2{\varepsilon }}^{pl} \text{d}\tau } \ne {\mathbf{0}}\) leading to incremental collapse or ratcheting with the structure failing due to excessive plastic deformations that result to large displacements.
3 Residual Stress Decomposition Method (RSDM)
Due to the cyclic loading, the elastic stress is also cyclic, and thus in a cyclic asymptotic stress state, the residual stress distribution is expected to be also cyclic. Exploiting this cyclic nature, one may decompose the residual stresses into Fourier series, and try to find the unknown Fourier coefficients. Thus, we may write [27]:
Differentiating the above with respect to τ one may write the following expression for the derivative:
Using the orthogonality properties of the trigonometric functions, one may get expressions for the Fourier coefficients of the cosine and sine series in terms of the residual stress derivatives:
The constant term may be estimated at the end of the cycle using the information at its beginning and at its end [27]:
where the subscripts b and e denote the beginning and the end of the cycle, respectively. Thus, it may be seen by Eqs. (9) and (10) that, by integrating over a cycle, the Fourier coefficients may be estimated, once the residual stress derivatives are provided.
These derivatives may be found by imposing compatibility and equilibrium at some predefined time points inside the cycle. To this end, we assume that our structure is discretized with finite elements (FEs). Using the rates of displacements of the nodes of the FE mesh one may write:
From Eqs. (5b) and (4) we may write:
Since the strain rates are kinematically admissible, the residual stress rates are self-equilibrated, and fixed supports have been assumed, one may write, for a virtual strain field \(\delta \dot{\user2{\varepsilon }}_{r}\), using the Principle of Virtual Work (PVW):
Combining Eq. (11) and its virtual form, together with Eqs. (12) and (13), we end up with:
or equivalently:
where K is the stiffness matrix, \(\dot{\user2{R}}\) is the rate vector of the nodal forces due to the plastic straining.
It has to be noted that this formulation, which uses the compatible residual strain vector [33], instead of the total strain vector, used in Ref. [27], although, obviously leading to the same results, requires less computations, as it avoids the additional evaluation of the derivatives of the elastic stresses.
The term in the r.h.s. of Eq. (14) accounts for plastic straining which will occur whenever the total stress (Eq. (2)) exceeds the yield surface (Figure 3). According to the closest point projection [35], return to the yield surface will be, along the vector \(\overrightarrow {CB}\), with the plastic strain rate \({\dot{\mathbf{\varepsilon }}}^{pl}\) directed along \(\overrightarrow {BC}\). The vector \(\overrightarrow {CA}\) equal to –σp is used instead, which is a kind of ‘radial return’ type of mapping along the known vector. This vector, which will be called plastic stress vector, whenever is different to zero, gives an equivalent measure of the plastic straining.
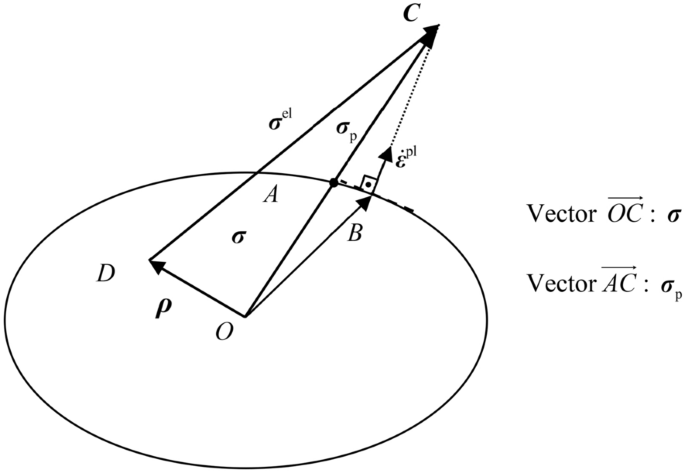
Estimation of plastic straining (von Mises yield surface)
3.1 Numerical Procedure
In the search for a cyclic solution, an iterative procedure has been written which updates the Fourier coefficients inside an iteration [27].
Firstly, we solve for the external loading, assuming elastic behavior, and obtain, for each cycle point τ, the elastic stress \({\varvec{\sigma}}^{el} (\tau )\) at each Gauss point (GP) of a continuum finite element.
Let us suppose that, after the completion of the iteration (μ), an estimate of the Fourier coefficients \({\varvec{a}}_{0}^{(\mu )} ,{\varvec{a}}_{k}^{(\mu )} ,{\varvec{b}}_{k}^{(\mu )}\) exists. The following steps are now followed:
-
1.
For a specific cycle point τ compute \({\varvec{\rho}}^{(\mu )} (\tau )\), at each GP, using Eq. (7):
$${\varvec{\rho}}^{(\mu )} (\tau ) = \frac{1}{2}{\varvec{a}}_{0}^{(\mu )} + \sum\limits_{k = 1}^{\infty } {\left\{ {\cos (2k\pi \tau ) \cdot {\varvec{a}}_{k}^{(\mu )} + \sin (2k\pi \tau ) \cdot {\varvec{b}}_{k}^{(\mu )} } \right\}} .$$(16) -
2.
Evaluate at each GP the total stress \({\varvec{\sigma}}^{(\mu )} (\tau )\), using Eq. (2):
$${\varvec{\sigma}}_{{^{{}} }}^{\left( \mu \right)} (\tau ) = {\varvec{\sigma}}^{el} (\tau ) + {\varvec{\rho}}_{{}}^{\left( \mu \right)} (\tau ).$$(17) -
3.
Calculate whether, at each GP, \(\overline{\sigma }^{(\mu )} (\tau ) > \sigma_{Y}\), where \(\overline{\sigma }\) and \(\sigma_{Y}\) are the effective and uniaxial yield stress respectively. In such a case compute \({\varvec{\sigma}}_{p}^{(\mu )} (\tau )\):
$$\xi = \frac{{\overline{\sigma }_{{}}^{\left( \mu \right)} (\tau ) - \sigma_{Y} }}{{\overline{\sigma }_{{}}^{\left( \mu \right)} (\tau )}} \Rightarrow {\varvec{\sigma}}_{p}^{(\mu )} \left( \tau \right) = \xi \cdot {\varvec{\sigma}}_{{}}^{\left( \mu \right)} \left( \tau \right).$$(18) -
4.
Assemble for the whole structure the rate vector of the nodal forces \(\dot{\user2{R}}(\tau )\), which is the r.h.s. of Eqs. (14), (15):
$$\dot{\user2{R}}^{(\mu )} (\tau ) = \int\limits_{V} {{\varvec{B}}^\text{T} \cdot {\varvec{\sigma}}_{p}^{\left( \mu \right)} (\tau )\text{d}V} .$$(19) -
5.
Solve the following iterative form of Eq. (15) and obtain \(\dot{\user2{r}}^{(\mu )} (\tau )\):
$$\user2{K\dot{r}}_{r}^{\left( \mu \right)} (\tau ) = \dot{\user2{R}}^{(\mu )} (\tau ).$$(20) -
6.
Evaluate at each GP the residual stress derivative rates, using Eqs. (12) and (11):
$${\varvec{\dot{\rho }}}^{{\left( \mu \right)}} (\tau ) = {\varvec{DB\dot{r}}}_{r} ^{{\left( \mu \right)}} (\tau ) - {\varvec{\sigma }}_{p}^{{\left( \mu \right)}} (\tau ).$$(21) -
7.
Repeat the steps 1‒6 for all the assumed cycle points.
-
8.
Perform a numerical integration over the cycle points and update the Fourier coefficients, making use of Eqs. (9) and (10):
$$\begin{gathered} {\varvec{a}}_{k}^{{\left( {\mu + 1} \right)}} = - \frac{1}{k\pi }\int\limits_{0}^{1} {\left\{ {\left[ {{\dot{\varvec{\rho }}}^{\left( \mu \right)} \left( \tau \right)} \right]\left( {{\text{sin}}2k\pi \tau } \right)} \right\}{\text{d}}\tau } {,} \hfill \\ {\varvec{b}}_{k}^{{\left( {\mu + 1} \right)}} = \quad \frac{1}{k\pi }\int\limits_{0}^{1} {\left\{ {\left[ {{\dot{\varvec{\rho }}}^{\left( \mu \right)} \left( \tau \right)} \right]\left( {{\text{cos}}2k\pi \tau } \right)} \right\}{\text{d}}\tau } {,} \hfill \\ \frac{{{\varvec{a}}_{0}^{{\left( {\mu + 1} \right)}} }}{2} = - \sum\limits_{k = 1}^{\infty } {{\varvec{a}}_{k}^{{\left( {\mu + 1} \right)}} } + \frac{{{\varvec{a}}_{0}^{\left( \mu \right)} }}{2} + \sum\limits_{k = 1}^{\infty } {{\varvec{a}}_{k}^{\mu } + } \int\limits_{0}^{1} {\left[ {{\dot{\varvec{\rho }}}^{\left( \mu \right)} \left( \tau \right)} \right]{\text{d}}\tau } . \hfill \\ \end{gathered}$$(22) -
9.
From the updated Fourier coefficients, evaluate the updated distribution of the residual stresses, at all the Gauss points, using Eq. (7), and check the convergence through their Euclidean norms at the end of the cycle:
$$\frac{{\left\| {{{\varvec{\uprho}}}_{{}}^{{\left( {\mu + 1} \right)}} (1)} \right\|_{2} - \left\| {{{\varvec{\uprho}}}_{{}}^{\left( \mu \right)} (1)} \right\|_{2} }}{{\left\| {{{\varvec{\uprho}}}_{{}}^{{\left( {\mu + 1} \right)}} (1)} \right\|_{2} }} \le tol{,}$$(23)
where tol is a specified tolerance.
If Eq. (23) holds, the procedure stops as a cyclic stress state (cs) has been reached, and \({{\varvec{\uprho}}}^{\left( \mu \right)} = {{\varvec{\uprho}}}^{{\left( {\mu + 1} \right)}} = {{\varvec{\uprho}}}^{cs}\); otherwise, go back to step 1 and repeat the process.
Once a cyclic stress state has been reached, we look at \({{\varvec{\upsigma}}}_{p}^{cs} = {{\varvec{\upsigma}}}_{p}^{{(\mu )}} = {{\varvec{\upsigma}}}_{p}^{{(\mu + 1)}}\), which was evaluated during the last iteration. We may determine the nature of the obtained solution, for each GP, by evaluating the following integral over the cycle:
with i spanning all the components of \({{\varvec{\upsigma}}}_{p}^{cs} (\tau )\).
Depending on the values of \(\alpha_{i}\) we may have:
-
a)
If \(\alpha_{i} \ne 0\), a state of ratcheting exists at this GP. If \(\alpha_{i} = 0\), the value of \(\sigma_{p,i}^{cs} (\tau )\) is checked for every cycle point τ.
-
b)
If \(\sigma_{p,i}^{cs} (\tau ) \ne 0\), the Gauss point is in a state of reverse plasticity, since this must hold for pairs of cycle points of equal value but of alternating sign.
-
c)
If \(\sigma_{p,i}^{cs} (\tau ) = 0\), the point has remained either elastic or has developed an elastic shakedown state.
For the case of all the Gauss points being either elastic or in a state of elastic shakedown, then the structure, under the given external loading, will also shakedown. On the other hand, if sufficient GPs are in a state of ratcheting, at the cyclic state, the structure will undergo incremental collapse. This, numerically, may be easily manifested, through the singularity of the stiffness matrix, which can be evaluated just at the end of the converged steady cycle, by zeroing the elasticity matrix D at the ratcheting GPs.
3.2 Examples
The procedure has been programmed in the open-source code FEAP [36], using the Fortran language. A value of tol=10−3 proved sufficient for accuracy. Two indicative examples of application are shown, one of a holed plate, which is a benchmark example, and a more sophisticated example, in terms of geometry and boundary conditions, of a framed structure. Brick elements have been used for their finite element implementation. Three terms of the Fourier series are used.
3.2.1 Holed Plate
The square plate is subjected to pressure loadings along the edges (Figure 4) and due to symmetry, only one quarter of the plate is discretized, with the boundary conditions along X and Y axes considered rolled. Let D be the diameter of the circle, L the length of the slab and d the thickness, with \(D/L = 0.2\), \(d/L = 0.05\). In the present work, the length L is equal to 0.2 m, the material properties are E = 210 GPa, v = 0.3 and σy = 360 MPa.
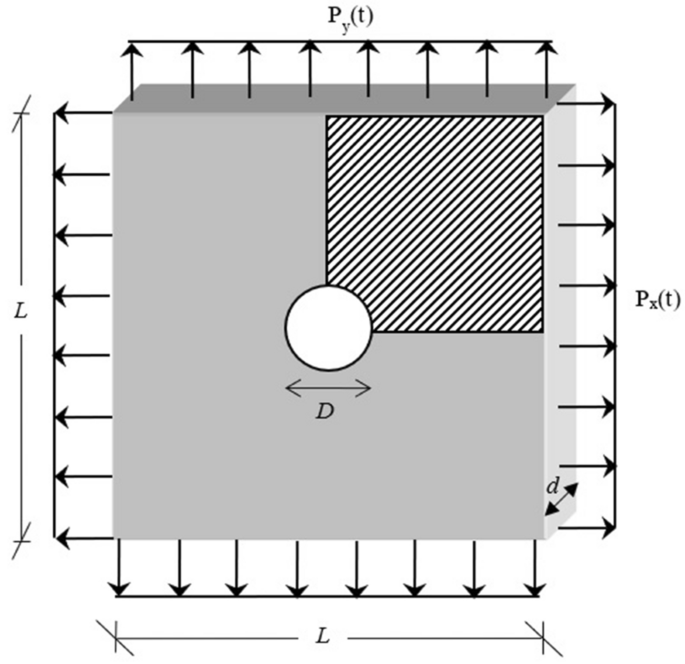
Geometry and loading of the plate
Fifty time points were adopted, just for the smoother appearance of the distribution of the stresses along one period, although much less time points (like thirty) could also be used.
Two different loadings cases are implemented as follows.
Case 1: Only \(P_{x} (\tau ) = 0.65\sigma_{y} \sin (2{\uppi }\tau )\) is applied.
The slab is discretized in 196 elements (Figure 5) and the asymptotic state of the structure proves to be alternating plasticity. One may see the alternating variation (Figure 6), over the cycle, of one of the components of the plastic stress vector of the most stressed Gauss point GP1. One may also realize that the corresponding integral (Eq. (24)) is approximately zero.

Local alternating plasticity mechanism

Predicted cyclic asymptotic state of the -xx stress component at GP 1
By plotting the very small, but nonetheless numerically nonzero, contours of the values of the integrals (Figure 5) at the GPs that have the same behavior around GP1, the local failure mechanism is revealed in this Figure. Finally, one may see the convergence of the RSDM in Figure 7. These results had been checked using plane elements ([27]) against the time stepping program Abaqus [25].

Convergence of the iterative procedure for load case 1
Case 2: Two forces are applied \(P_{x} (\tau ) = 0.85\sigma_{y}\) and \(P_{y} (\tau ) = 0.65\sin^{2} (2{\uppi }\tau )\)
In order to show the robustness of the method, two different discretizations are adopted, one with a coarse mesh, consisted of 98 elements (Figure 8(a)) and one with a finer mesh of 392 elements (Figure 8(b)). One may see the ratcheting behavior that RSDM predicts by considering, for example, the asymptotic -xx component of the plastic stress distribution at GP1 over the cycle (Figure 9), where clearly in either of the two discretizations the distribution is of the same sign, rendering also the integral (Eq. (24)) much greater than zero.

Ratcheting mechanism for load case 2: (a) coarse mesh, (b) finer mesh

Predicted cyclic asymptotic state of the xx-stress component at GP 1 for load case 2
By plotting the contours of the values of these integrals (Figure 8) at the GPs, that have also ratcheting behavior, one may realize the fact that a ratcheting mechanism appears in both discretizations. Finally, the convergence of the RSDM may be seen in Figure 10. These results had been checked in Ref. [27], using plane elements, against the time stepping program Abaqus [25].

Convergence of the iterative procedure for load case 2
3.2.2 Frame Example
A second example of application is an example of a framed structure (Figure 11), that has originally been considered in Ref. [37]. The following mechanical properties were selected: E=2×10⁵ N/mm2, \(\nu\) =0.3, σy=100 N/mm2. The structure is shown in Figure 12 discretized by 350 hexagonal brick elements of 8 Gauss points.
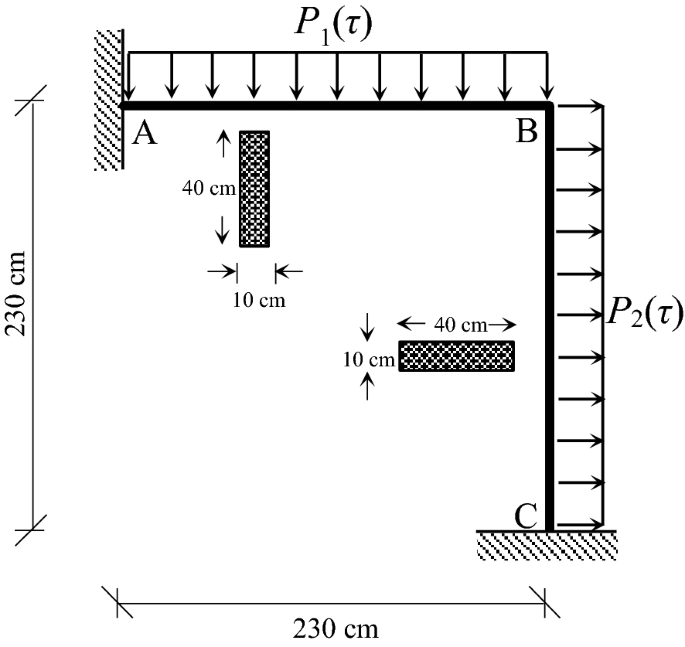
Geometry and loading of the frame

2D view and 3d view of the discretized frame using 350 brick elements
The variations of the loads inside one period of loading are given by:
The plotting of the above variations of the two loads may be seen in Figure 13. The variations are randomly chosen, with the only restriction that the ratio of the maximum values of the loads \(P_{1}^{*} /P_{2}^{*}\) is equal to 3. This point, which may be seen herein (point A) οn Figure 27, where the shakedown boundary is constructed, produces a ratcheting behavior as has been noted by Ref. [37]. Indeed, RSDM predicts a ratcheting mechanism (Figure 14) which is quite similar with the one shown in Ref. [37], that was produced as an upper bound shakedown solution, in the context of an incremental- iterative algorithm to find the shakedown load. The advantage of the RSDM is its simplicity, its pure iterative nature and its generality to account for any asymptotic behavior.

Loading variation inside a cycle

Ratcheting mechanism
In Figure 15 one may see the variation along the cycle period of the \(\sigma_{p,xx}\) steady state component of the plastic stress vector at the GP1. All the other steady state stresses components and at all the Gauss points inside the ratcheting mechanism have such a typical, of the same sign, variation.

Predicted cyclic asymptotic state of the \(\sigma_{p,xx}\) component at GP1
The convergence of the procedure towards the steady state is shown in Figure 16.

Convergence of the iterative procedure
4 Residual Stress Decomposition Method for Shakedown (RSDM-S)
In most cases the exact time history of the loads is not known, but only their variation intervals. Shakedown is the only safe asymptotic state and it is important to provide safety margins. A direct method is the only way that this task may be accomplished. The loads may be applied proportionally (Figure 17(a)) or independently (Figure 17(c)), between the two extreme values of 0 and \(P_{1}^{*}\) and \(P_{2}^{*}\) for the two loads \(P_{1}^{{}}\) and \(P_{2}^{{}}\), respectively. Smooth time functions may be used to describe a cyclic loading program between the two extremes in the time domain (Figure 17(b) and Figure 17(d)). Of course, minimum values for the two loads different than zero may be handled accordingly.
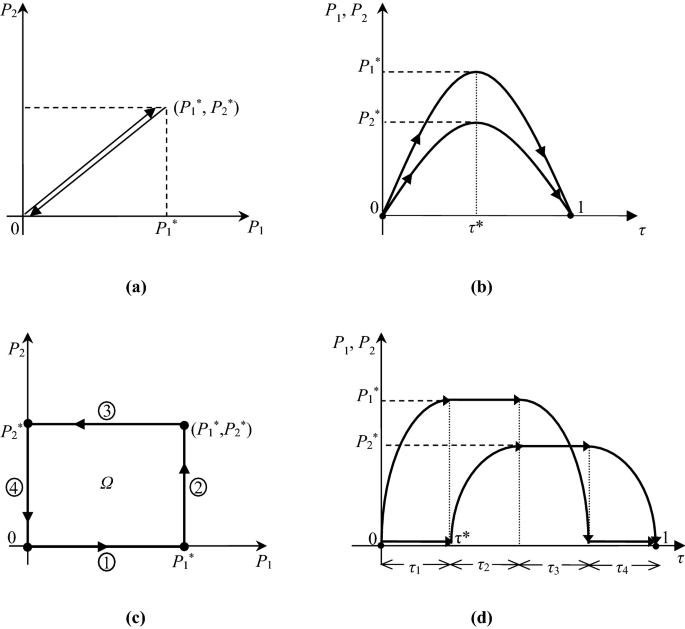
Proportional cyclic loads: (a) in loading domain, (b) in time domain; Independent cyclic loads: (c) in loading domain, (d) in time domain
The conditions for elastic shakedown given by Melan [2] are as follows.
-
a)
The structure will shake down under a cyclic loading, if there exists a time-independent distribution of residual stresses \(\overline{\user2{\rho }}\) such that, under any combination of loads inside prescribed limits, its superposition with the elastic stresses \({\varvec{\sigma}}^{el}\), i.e., \({\varvec{\sigma}}^{el} + \overline{\user2{\rho }}\), results to a safe stress state at any point of the structure.
-
b)
Shakedown never takes place unless a time-independent distribution of residual stresses can be found such that under all the possible load combinations the sum of the residual and elastic stresses constitutes an allowable stress state.
These statements define the limit cycle for a structure subjected to a prescribed loading program. Parameters of this cycle are the shakedown load factor and the constant in time residual stress distribution which are unique and independent of the preceding deformation history [21].
König [38] has proved that if a structure shakes down under a cyclic loading containing all the vertices of the convex loading domain Ω, like the one in Figure 17(c), then it shakes down for any loading path contained in Ω.
Thus, a cyclic loading that uses as cycle points the vertices of the loading path \((0 \to (P_{1}^{*} ,P_{2}^{*} ) \to 0)\) (for proportional loading) or \((0 \to P_{1}^{*} \to (P_{1}^{*} ,P_{2}^{*} ) \to P_{2}^{*} \to 0)\) for independent loading, or cycle points from the respective cyclic program in the time domain may be used.
This cyclic loading, or equivalently the loading domain, may be varied isotropically through the multiplication with a factor γ. Through the RSDM-S procedure, we seek to find γsh for which the adopted cyclic loading makes the structure shakedown. Starting from a value high above, a sequence of iterations takes place that shrinks the loading domain by lowering the load factor. Inside an iteration, RSDM is used to provide a cyclic solution for the current load factor.
The procedure stops when the conditions of the limit cycle are met, where the only remaining Fourier coefficient in the residual stress distribution is the constant term.
4.1 Numerical Procedure
RSDM-S consists of two iteration loops, one inside the other, the outer loop is controlled by the parameter μ whereas the inner loop by the parameter κ.
The procedure has to start from a load factor which is above the shakedown load. Such a value could be given by Eq. (25), which finds the non-zero minimum effective elastic stress at a cycle point τ*, which could correspond, for example, to a maximum of one of the loads (see Figure 17)
With this choice, the starting value is guaranteed to be much higher than the shakedown load or even the limit load, since all the finite elements, at least at τ*, will have become plastic. Although sometimes this value is quite high, with the next iteration this value drops substantially.
After an initialization phase, i.e., \({\varvec{a}}_{0}^{(0)} = {\varvec{a}}_{k}^{(0)} = {\varvec{b}}_{k}^{(0)} = {\varvec{0}} \to {\varvec{\rho}}_{0}^{(1)} (\tau ) = {\varvec{0}},\) κ = 1, μ = 1, φ(1) = 0, the following iterative steps are then followed:
Using the load factor of the outer loop, which is constantly updated, we enter an inner loop of iterations controlled by κ. The steps of this inner loop are virtually the same steps with the RSDM.
-
1.
The following expression is computed for a cycle point τ and for each GP of the mesh:
-
2.
It is checked whether the total effective stress \(\overline{\sigma }^{(\mu )} (\tau ) > \sigma_{y}\); if this does not hold, we set \(\xi = 0\), otherwise:
$$\xi = \frac{{\overline{\sigma }_{{}}^{\left( \kappa \right)} (\tau ) - \sigma_{y} }}{{\overline{\sigma }_{{}}^{\left( \kappa \right)} (\tau )}} \Rightarrow {\varvec{\sigma}}_{pl}^{(\kappa )} \left( \tau \right) = \xi \cdot {\varvec{\sigma}}_{{}}^{\left( \kappa \right)} \left( \tau \right).$$(27)
This operation is a radial return type rule according to Figure 3. Steps 1 and 2 are repeated for every GP.
-
3.
Assemble for the whole structure the new rate vector of the nodal forces \(\dot{\user2{R}}^{(\kappa )} (\tau )\):
We find an update for \(\dot{\user2{r}}^{(\kappa )} (\tau )\) using the relation
-
4.
A value for \(\dot{\user2{\rho }}^{(\kappa )} (\tau )\) is evaluated at each GP.
The steps 1‒4 are repeated for all the cycle time points.
-
5.
By performing numerical time integration over the whole cycle, we may obtain an update of the Fourier coefficients:
-
6.
From these updates one may get an update for \({\varvec{\rho}}_{(\kappa + 1)}^{(\mu - 1)} (\tau )\) using the iterative form of Eq. (7):
$${{\varvec{\uprho}}}_{{(\kappa + 1)}}^{{(\mu - 1)}} (\tau ) = \frac{1}{2}{\varvec{a}}_{0}^{{(\kappa + 1)}} + \sum\limits_{k = 1}^{\infty } {\left\{ {{\text{cos(}}2k\pi \tau ) \cdot {\varvec{a}}_{k}^{{(\kappa + 1)}} + {\text{sin(}}2k\pi \tau ) \cdot {\varvec{b}}_{k}^{{(\kappa + 1)}} } \right\}} .$$(32)
-
7.
The sum of the norms of the vectors of the coefficients of the trigonometric part of the Fourier series of the residual stresses, is found:
$$\varphi^{{(\kappa + 1)}} = \sum\limits_{k = 1}^{\infty } {\left\| {{\varvec{a}}_{k}^{{(\kappa + 1)}} } \right\|} + \sum\limits_{k = 1}^{\infty } {\left\| {{\varvec{b}}_{k}^{{(\kappa + 1)}} } \right\|} .$$(33)
-
8.
Whether a cyclic solution is reached is controlled by the following inequality [32]:
$$\left| {\varphi^{{(\kappa + 1)}} - \varphi^{{(\kappa )}} } \right| < tol.$$(34)
-
9.
If Eq. (34) does not hold, we set κ=κ+1 and repeat from step 1; otherwise, we exit the inner loop and set:
$$\begin{gathered} {\varvec{\rho}}_{(1)}^{(\mu )} (\tau ) = {\varvec{\rho}}_{{(\kappa + 1)}}^{(\mu - 1)} (\tau ), \hfill \\ \varphi \left( {\gamma_{{}}^{\mu } } \right) = \varphi^{{(\kappa + 1)}} . \hfill \\ \end{gathered}$$(35)
-
10.
An update of the loading factor may be calculated:
$$\gamma_{{}}^{{\left( {\mu + 1} \right)}} = \gamma_{{}}^{\left( \mu \right)} - \omega \cdot [\varphi \left( {\gamma_{{}}^{\left( \mu \right)} } \right)].$$(36)
It should also be noted that ω is a convergence parameter, which is needed so that the procedure does not bypass the shakedown factor [29, 32]. This may be linked with a predefined tolerance for \(\varphi^{(\kappa )}\) which controls and stops the iterations (e.g., 10−3, 10−4).
In newer research [33], it is shown that this factor can be avoided.
-
11.
The following inequality is checked:
In case this does not hold, go back to step 1 and start a new iteration with μ=μ+1; otherwise, a shakedown state has been reached and:
Accurate results are obtained for a value of \(tol \simeq 10^{ - 3}\) with δ being something smaller than tol, e.g., 10−4.
4.2 Examples
Three different representative examples of application of the RSDM-S are presented herein. Only three terms form the Fourier series are needed (the constant term and the first two terms of the trigonometric series).
4.2.1 Holed Plate
The first example is the benchmark example of a holed plate under mechanical and thermal loads. Shakedown domains are obtained by running RSDM-S for different ratios of the maximums of the applied loads.
-
a)
The plate of Figure 4 is subjected to two mechanical loads P1 and P2 along the x and the y direction, respectively, varying proportionally (Figure 17(a), (b)). The meshing of 98 brick elements has been used.
The shakedown domain may be seen in Figure 18 and a typical convergence towards shakedown in Figure 19.

Shakedown domain by RSDM-S for the proportional loading case
Convergence of the procedure for proportional loading for the pair \((P_{1}^{*} ,P_{2}^{*} ) = (1,0.5)\)
Results have been verified in Ref. [29] using Ref. [39].
-
b)
The plate is subjected to the two loads P1 and P2 that now vary independently (Figure 17(c), (d)). Using time functions, in the time domain as the ones described in Ref. [29], at least 20 time points should be considered. If the considered domain is the loading domain only 5 time points are used.
The shakedown domain may be seen in Figure 20, whereas a typical convergence towards shakedown in Figure 21.

Shakedown domain by the RSDM-S for independent loadings

Convergence of the RSDM-S for \((P_{1}^{*} /P_{2}^{*} ) = (1/0.2)\)
Geometry and loading of the plate
-
iii)
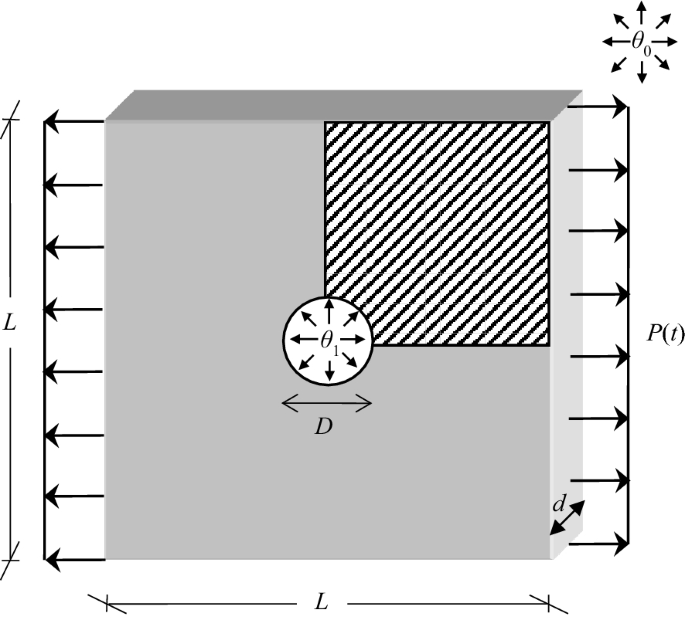
The plate is subjected to cyclic thermal load and pressure loading (Figure 22).
The pressure acts along the one edge and the temperature varies from the inner to the outer side according to the law:
The temperature \(\theta_{0}\) is taken zero; the coefficient of thermal expansion is considered equal to \(5 \times 10^{ - 5} \, ^\circ {\text{C}}^{ - 1}\). The loads are applied independently in the form of a rectangular loading, between zero and a maximum value, i.e., \(P \in [0,P^{*} ]\) and \(\Delta \theta \in [0,\Delta \theta^{*} ]\).
The FE model consists of 200 brick elements with 8 GP per element (Figure 23).

Finite element meshing
The stresses due to the thermal load may be considered as added to the elastic stresses caused by the mechanical load. A thermal and mechanical load were considered, originally, in Ref. [30].
The problem was solved, in the time domain, using second order time functions with 30 time points. Results of the shakedown domain may be seen in Figure 24, where \(\sigma_{th}\) is the maximum effective elastic thermal stress due to the fluctuating temperature. This shakedown domain is quite similar to a Bree-type diagram [18]. This diagram was examined in Ref. [31], where the simultaneous use of RSDM-S and RSDM made possible to establish, numerically, on one hand the shakedown boundary, and on the other, to identify ratcheting regions.

Shakedown domain for a mechanical and a thermal load
In Ref. [32], RSDM-S is used to produce a 3D shakedown domain, resulting from a combination of two mechanical and a thermal load. It is proved there that the iterations needed for the 3D problem to converge are of the same order with the ones that would be needed to solve the 2D problem. Thus, the computing time is virtually the same. This is in contrast with a shakedown method that uses an optimization algorithm since between the 2D and the 3D cases there would be more than double the number of variables and the number of constraints [40].
In the same work ([32]), RSDM-S is extended to cater for an n-dimensional loading domain, of a zero origin, by creating automatically the cyclic loading program that would pass through the \(2^{n} - 1\) vertices of this domain. This may be accomplished by making use of a combinatorial algorithm (e.g., Ref. [41]).
4.2.2 Frame Example
The framed structure of Figure 11 is considered next. Two different independent loading cases were examined.
Case 1. The two distributed loads P1 and P2 act independently \(0 \le P_{1} \le P_{1}^{*}\) and \(0 \le P_{2} \le P_{2}^{*}\) (Figure 17(c), (d)), with the ratio \(P_{1}^{*} /P_{2}^{*} = 3\). The frame was discretized with 400 eight-noded plane stress iso-parametric finite elements with 3×3 Gauss integration points [29].
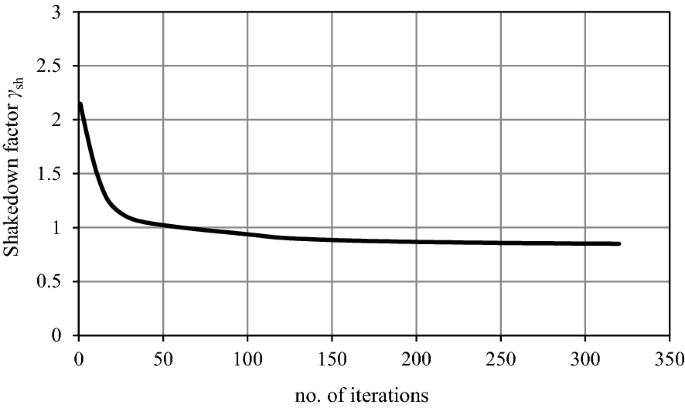
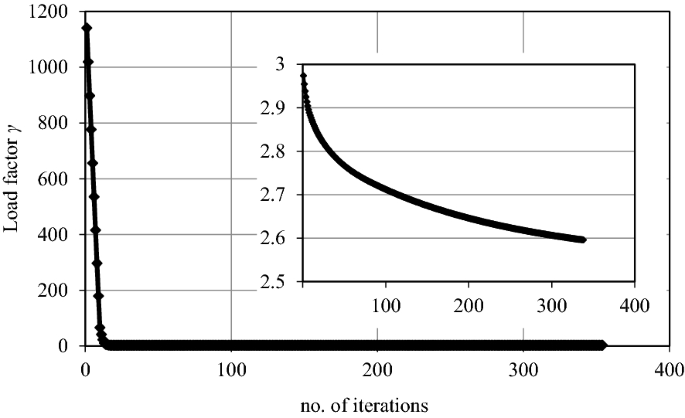
For this example, the initial convergence parameter ω needed to be halved twice, in order to converge and the shakedown factor was found 2.597. It may be seen that although the procedure started from a very high initial load factor, it descended quite rapidly (Figure 25). There is a smooth convergence, as it may be seen (insert of the Figure) towards the shakedown value, after the initial descent.
Convergence of the RSDM-S towards shakedown for the case 1
The same example was run, recently [33], using the discretization with the 350 brick elements shown in Figure 12 and a numerical scheme where ω is not needed. The shakedown factor was found approximately the same of about 2.58.
By varying the ratio of the extreme values of the two loads, analogous points may be taken. Thus, the shakedown domain depicted in Figure 26 may be established.

Shakedown domain for the case1
Case 2. A loading domain where the minimum values of the loads are different to zero is tried next. The loads now act also independently but with the following variations: \(0.4P_{1}^{*} \le P_{1} (\tau ) \le P_{1}^{*}\) and \(0.4P_{2}^{*} \le P_{2} (\tau ) \le P_{2}^{*}\). This type of loading has been considered in Ref. [42]. RSDM-S was run for various ratios of \(P_{1}^{*} /P_{2}^{*}\). The shakedown domain is shown in Figure 27. One may see a perfect match with the domain that was produced by Ref. [42], where an optimization algorithm was used. Also, the result for \(P_{1}^{*} /P_{2}^{*} = 3\), that was produced in Ref. [37], with a quite involved incremental-iterative procedure of a strain driven algorithm, using different elements and a much denser mesh, is virtually on the boundary produced by RSDM-S (Figure 27).

Shakedown domain for the case 2
Point A, which lies outside the shakedown boundary, is the one that has been used earlier in this work by RSDM to verify ratcheting behavior, referred to by both Ref. [37] and Ref. [42].
4.2.3 Tee-junction
Recently RSDM-S has been extended to cater for applied displacement type of loadings [33]. Tee-junctions are widely used for the connection of piping elements, which form parts of pipelines. Thus tee-junctions may be subjected to sever earthquake loading that may be simulated by cyclic applied displacements.
The junction shown in Figure 28 is composed of a main pipe with an outer diameter of 20.32 cm and thickness of 8.18 mm and is connected to a secondary pipe, called ‘branch’, which has a diameter of 15.24 cm and thickness of 10.97 mm. The main pipe is considered fixed at the ends and a displacement is applied at the free end of the branch along the x direction.

Tee junction and mesh discretization
The model consists of 9936 brick elements. The yield displacement is equal to 1.43 mm. The shakedown displacement was estimated by the RSDM-S as 2.6 mm. One may see the smooth convergence towards shakedown in Figure 29, under the numerical scheme discussed in Ref. [33] that makes ω obsolete. The result was validated by the step-by-step analysis software Abaqus. Two different analyses were performed, one below and one above 2.6 mm. With a cyclic displacement having a maximum value of 2.4 mm, one may see that the evolution of the plastic strains stops after the first cycles (Figure 30). The graph is plotted for the most stressed point, which is point A (Figure 31). One may also see in Figure 31 the final spread of plasticity at this shakedown state.

Convergence of the displacement towards shakedown value
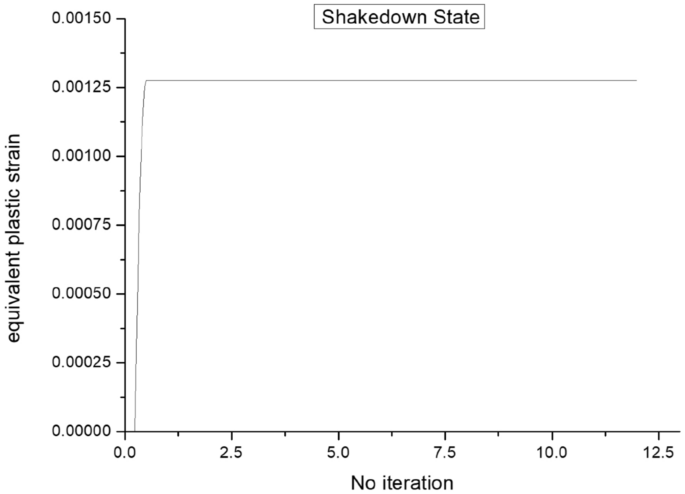
Equivalent plastic strain evolution for imposed maximum cyclic displacement of 2.4 mm

Spread of plastic strain at the shakedown state of 2.4 mm
On the other hand, for the second analysis, for which the maximum cyclic displacement was set equal to 3.2 mm there is a constant evolution of plastic strains (Figure 32) at point A, which shows that ratcheting has taken place.
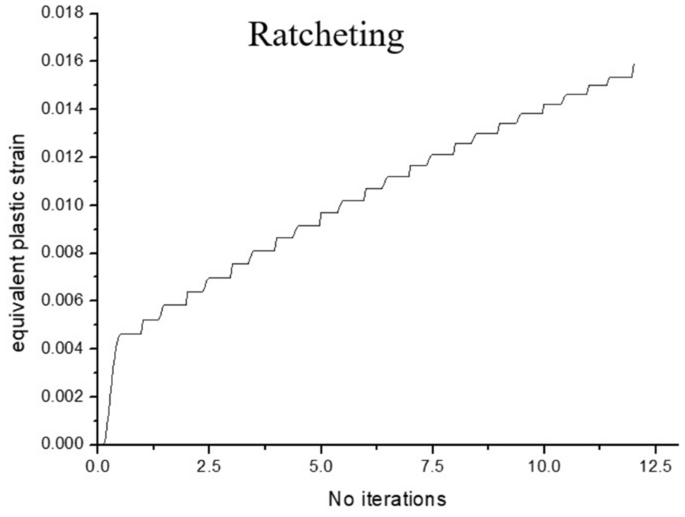
Equivalent plastic strain evolution at point A for imposed maximum cyclic displacement of 3.2 mm
As a final remark, from the common example of the framed structure, studied in both the presented methods, because of their common basis, it is obvious that one may easily determine directly to what kind of asymptotic state a cyclic loading of a prescribed history will lead the structure and at the same time when the history is not known, what are the limits of this loading that would lead the structure to a safe asymptotic state.
5 Conclusions
The Residual Stress Decomposition Method (RSDM) is a direct method that may determine any kind of cyclic asymptotic state of a structure subjected to cyclic loading. The power of the method lies in the fact that it directly addresses the physics of the asymptotic cycle, by exploiting the expected cyclic behavior of the residual stresses. Following their decomposition in Fourier series, a computational procedure is constructed, which finds the Fourier coefficients in an iterative manner. Plasticity effects may be easily accounted for, in a radial type return, on the yield surface, of the total stress vector, which is the sum of the residual stress and of a purely elastic solution. Regions of unsafety, either of alternating plasticity or of incremental collapse mechanism, may be manifested in a simple way.
RSDM-S is a direct method to compute shakedown limits of thermomechanical loading domains. It addresses the physics of the limit cycle, where the residual stresses are constant in time. Starting from high above shakedown, the procedure keeps shrinking the loading domain until the only remaining term in the Fourier decomposition of the residual stresses is the constant term.
With no optimization algorithm needed, both approaches may be implemented in any existing FE code. They are both numerically stable and computationally efficient. Only three Fourier coefficients are needed and the stiffness matrix needs to be decomposed only once. Although von Mises elastic-perfectly plastic material has been used, a hardening behavior may also be accounted for.
References
D C Drucker. A definition of stable inelastic material. ASME Journal of Applied Mechanics, 1959, 26: 101-106.
E Melan. Zur Plastizität des räumlichen Kontinuums, Ingenieur-Archiv, 1938, 9: 116–126.
W Koiter. General theorems for elastic-plastic solids. In: Progress in Solid Mechanics. I N Sneddon, R Hill, North-Holland, 1960.
G Maier. Shakedown theory in perfect elastoplasticity with associated and nonassociated flow-laws: a finite element, linear programming approach. Meccanica, 1969, 4: 1–11.
A Spagnoli, G Beccarelli, M Terzano, et al. A numerical study on frictional shakedown in large-scale three-dimensional conforming elastic contacts. International Journal of Solids and Structures, 2021, 217-218: 1-14.
J-H Ri, H-S Hong. A basis reduction method using proper orthogonal decomposition for shakedown analysis of kinematic hardening material. Computational Mechanics, 2019, 64: 1-13.
H V Do, H Nguyen-Xuan. Limit and shakedown isogeometric analysis of structures based on Bezier extraction. European Journal of Mechanics A/Solids, 2017, 63: 149-164.
J-W Simon, D Höwer, D Weichert. A starting-point strategy for interior-point algorithms for shakedown analysis of engineering structures. Engineering Optimization, 2014, 46(5): 648-668.
D Weichert, A Hachemi, J Simon. Progress in lower bound direct methods. ASME Journal of Pressure Vessel Technology, 2015, 137(3): 031005.
C V Le, T D Tran, D C Pham. Rotating plasticity and nonshakedown collapse modes for elastic–plastic bodies under cyclic loads. International Journal of Mechanical Sciences, 2016, 111: 55-64.
F Qin, L Zhang, G Chen, et al. Lower bound limit and shakedown analysis of orthotropic materials. Mathematics and Mechanics of Solids, 2019, 25: 2037-2049.
J Zhang, A Oueslati, W Q Shen, et al. Shakedown analysis of a hollow sphere by interior-point method with non-linear optimization. International Journal of Mechanical Sciences, 2020, 175: 105515.
N T Tran, M Staat. Direct plastic structural design under lognormally distributed strength by chance constrained programming. Optimization and Engineering, 2020, 21: 131-157.
K Li, G Cheng, Y Wang, et al. A novel primal-dual eigenstress-driven method for shakedown analysis of structures. International Journal for Numerical Methods in Engineering, 2021, 122: 2770-2801.
A R S Ponter, K F Carter. Limit state solutions, based upon linear solutions with a spatially varying elastic modulus. Computer Methods in Applied Mechanics & Engineering, 1997, 140: 237-258.
H F Chen, A R S Ponter. A method for the evaluation of a ratchet limit and the amplitude of plastic strain for bodies subjected to cyclic loading. European Journal of Mechanics A/Solids, 2001, 20: 555-571.
A R S Ponter, H F Chen. A direct method on the evaluation of ratchet limit. ASME Journal of Pressure Vessel Technology, 2010, 132(4): 041202.
J Bree. Elastic-plastic behaviour of thin tubes subjected to internal pressure and intermittent high-heat fluxes with application to fast-nuclear-reactor fuel elements. Journal of Strain Analysis, 1967, 2: 226-238.
R Adisi-Asl, W Reinhardt. Non-cyclic shakedown/ratcheting boundary determination - Part 1: Analytical approach. International Journal of Pressure Vessels and Piping, 2011, 88: 311-320.
J Abou-Hanna, T E McGreevy. A simplified ratcheting limit method based on limit analysis using modified yield surface. International Journal of Pressure Vessels and Piping, 2011, 88: 11-18.
D A Gokhfeld, O F Cherniavsky. Limit analysis of structures at thermal cycling. Sijthoff & Noordhoff, 1980.
M Lytwyn, H F Chen, A R S Ponter. A generalized method for ratchet analysis of structures undergoing arbitrary thermo-mechanical load histories. International Journal for Numerical Methods in Engineering, 2015, 104: 104-124.
R SantAnna, N Zouain. A direct method for ratchet boundary determination. European Journal of Mechanics A/Solids, 2019, 75: 156-168.
M H Maitournam, B Pommier, J-J Thomas. Determination of the asymptotic response of a structure under cyclic thermomechanical loading. Comptes Rendus Mécanique, 2002, 330(10): 703-708.
Abaqus 6.14. Theory & User’s Manual. Dassault Systems, 2014.
N Zouain, R SantAnna. Computational formulation for the asymptotic response of elastoplastic solids under cyclic loads. European Journal of Mechanics A/Solids, 2017, 61: 267-278.
K V Spiliopoulos, K D Panagiotou. A direct method to predict cyclic steady states of elastoplastic structures. Computer Methods in Applied Mechanics & Engineering, 2012, 223-224: 186-198.
K V Spiliopoulos. A simplified method to predict the steady cyclic stress state of creeping structures. ASME Journal of Applied Mechanics, 2002, 69: 148-153.
K V Spiliopoulos, K D Panagiotou. A residual stress decomposition based method for the shakedown analysis of structures. Computer Methods in Applied Mechanics & Engineering, 2014, 276: 410-430.
K V Spiliopoulos, K D Panagiotou. A numerical procedure for the shakedown analysis of structures under cyclic thermomechanical loading. Archives of Applied Mechanics, 2015, 85: 1499-1511.
K D Panagiotou, K V Spiliopoulos. Assessment of the cyclic behavior of structural components using novel approaches. ASME Journal of Pressure Vessel Technology, 2016, 138: 041201.
K V Spiliopoulos, K D Panagiotou. An enhanced numerical procedure for the shakedown analysis in multidimensional loading domains. Computers & Structures, 2017, 193: 155-171.
I A Kapogiannis, K V Spiliopoulos. Recent updates of the residual stress decomposition method for shakedown analysis. In: A A Pisano, K V Spiliopoulos, D Weichert. Direct Methods: Methodological progress and engineering applications. Springer Nature, 2021: 117-136.
C O Frederick, P J Armstrong. Convergent internal stresses and steady cyclic states of stress. Journal of Strain Analysis, 1966, 1: 154-169.
J C Simo, T J R Hughes. Computational inelasticity. Springer, 1988.
R L Taylor. FEAP-Finite element analysis program. University of California, Berkeley, 2014.
G Garcea, G Armentano, S Petrolo, et al. Finite element shakedown analysis of two-dimensional structures. International Journal for Numerical Methods in Engineering, 2005, 63: 1174-1202.
J A König. Shakedown of elastic-plastic structures. Elsevier, 1987.
A R S Ponter, M Engelhardt. Shakedown limits for a general yield condition: implementation and application for a von Mises yield condition. European Journal of Mechanics A/Solids, 2000, 19: 423-445.
J W Simon, D Weichert. Shakedown analysis with multidimensional loading spaces. Computational Mechanics, 2012, 49: 477-485.
A Nijenhuis, H S Wilf. Combinatorial algorithms. Academic Press, 1978.
P T Pham. Upper bound limit and shakedown analysis of elastic-plastic bounded linearly kinematic hardening structures. RWTH Aachen University, 2011.
Acknowledgements
Not applicable.
Funding
Not applicable.
Author information
Authors and Affiliations
Contributions
KS has developed the theoretical & the numerical analysis part of the method. He also wrote the manuscript. IK was responsible for programming the method and producing the numerical examples. All authors read and approved the final manuscript.
Author’s Information
Konstantinos V. Spiliopoulos, born in 1955, is a Professor of Structural Mechanics at Institute of Structural Analysis and Antiseismic Research, School of Civil Engineering of the National Technical University of Athens (NTUA), Greece. He is currently the Director of this Institute. He received his Diploma in Civil Engineering from NTUA and holds a PhD Degree in Structural Mechanics from Department of Aeronautics of Imperial College of Science & Technology, University of London, UK. He is the main guest editor of the SNAS Journal Topical Collection in Engineering ‘Limit States Analysis and Design of Structures and Materials’. His research interests include computational structural mechanics, inelasticity, failure of materials and structures, nonlinear reinforced concrete analysis.
Ioannis A. Kapogiannis, born in 1989, is currently a PhD candidate at Institute of Structural Analysis and Antiseismic Research, School of Civil Engineering of the National Technical University of Athens (NTUA), Greece. He received his Diploma in Civil Engineering from University of Patras and a master degree on the analysis and design of earthquake resistant structures of the NTUA. His research interests include inelastic analysis of structures and direct methods.
Corresponding author
Ethics declarations
Competing Interests
The authors declare that they have no competing interests.
Rights and permissions
Open Access This article is licensed under a Creative Commons Attribution 4.0 International License, which permits use, sharing, adaptation, distribution and reproduction in any medium or format, as long as you give appropriate credit to the original author(s) and the source, provide a link to the Creative Commons licence, and indicate if changes were made. The images or other third party material in this article are included in the article's Creative Commons licence, unless indicated otherwise in a credit line to the material. If material is not included in the article's Creative Commons licence and your intended use is not permitted by statutory regulation or exceeds the permitted use, you will need to obtain permission directly from the copyright holder. To view a copy of this licence, visit http://creativecommons.org/licenses/by/4.0/.
About this article

Cite this article
Spiliopoulos, K.V., Kapogiannis, I.A. RSDM: A Powerful Direct Method to Predict the Asymptotic Cyclic Behavior of Elastoplastic Structures. Chin. J. Mech. Eng. 34, 140 (2021). https://doi.org/10.1186/s10033-021-00658-0
Received:
Revised:
Accepted:
Published:
DOI: https://doi.org/10.1186/s10033-021-00658-0