- Original Article
- Open access
- Published:
Statistical Analyses of the Strengths of Particulate Reinforced Metal Matrix Composites (PRMMCs) Subjected to Multiple Tensile and Shear Stresses
Chinese Journal of Mechanical Engineering volume 34, Article number: 142 (2021)
Abstract
For design and application of particulate reinforced metal matrix composites (PRMMCs), it is essential to predict the material strengths and understand how do they relate to constituents and microstructural features. To this end, a computational approach consists of the direct methods, homogenization, and statistical analyses is introduced in our previous studies. Since failure of PRMMC materials are often caused by time-varied combinations of tensile and shear stresses, the established approach is extended in the present work to take into account of these situations. In this paper, ultimate strengths and endurance limits of an exemplary PRMMC material, WC-Co, are predicted under three independently varied tensile and shear stresses. In order to cover the entire load space with least amount of weight factors, a new method for generating optimally distributed weight factors in an n dimensional space is formulated. Employing weight factors determined by this algorithm, direct method calculations were performed on many statistically equivalent representative volume elements (SERVE) samples. Through analyzing statistical characteristics associated with results the study suggests a simplified approach to estimate the material strength under superposed stresses without solving the difficult high dimensional shakedown problem.
1 Introduction
Owing to its outstanding strength-to-weight ratio and excellent global isotropy, particulate reinforced metal matrix composites (PRMMCs) consisted of ductile metal matrix and discrete ceramic reinforcement particles became increasingly popular in recent years. In numerous applications where the weight of a structural component is a critical issue, besides optimizing the geometry and topology of a part, another plausible strategy is to replace the metallic materials by PRMMCs. To fully exploit the potential of PRMMC materials, it requires their mechanical behaviors as well as the relationships between these behaviors and underlying material structure to be well understood. Since experimental investigations alone provide only limited information on these issues, advanced micromechanical models were developed and employed as supplementary means. Using these models it was carefully examined and clarified in a large body of works how multiple microstructural characteristics, e.g. particle shape [1, 2], size [3, 4], distribution [5, 6] individually and jointly influence global material properties ranging from coefficient of thermal expansion [7] to the rate of crack propagation [8].
Among global material behaviors investigated, the load bearing capacity of PRMMCs occupies a central place. While due to the complexity of service condition that most mechanical parts made by PRMMCs are subjected to, it is essential that the material strengths under both monotonic and cyclic loading can be accurately predicted. To this end, direct method based on Melan and Koiter’s theorem has a remarkable advantage over the conventional incremental method since they allow the strengths to be calculated without considering the specific load history. Using direct methods (DM) constructed from static theorem in conjunction with the finite element (FE) based homogenization techniques, Weichert et al. [9], Magoariec et al. [10], Bourgeois et al. [11], Zhang et al. [12], You et al. [13], Chen et al. [14], Zhang et al. [15, 16] elucidated in their works how the macroscopic feasible load domains of different heterogeneous materials can be calculated. Similarly, macroscopic strengths were also evaluated from numerical methods developed based on kinematic theorem, Carvelli [17], Chen and Ponter [18], Barrera et al. [19], Li and Yu [20, 21], Canh et al. [22].
Strengths of PRMMC materials are not only affected by the material microstructure, but also by the type of loading they are exerted to. Compared to the uniaxial loading, microstructure plays a more important role in determining the global material strength under multiaxial loading featured by superimposed tensile and shear stresses [23, 24]. When the material strength is predicted in such circumstance, i.e., given that multiple tensile and shear stresses vary independently, then in contrast to the severe difficulty by using incremental method the problem can be tackled more easily and with a more affordable cost by adopting direct method thanks to their path-independent nature. Extending direct method to high dimensional load space and improving the numerical efficiency in solving the resulting optimization problem have been extensively studied in several works, e.g., Kim and You [25], Simon and Weichert [26] explained how to formulate and solve such a problem by nonlinear programming, Spiliopoulos and Panagiotou [27] by a novel numerical procedure called Residual Stress Decomposition Method for Shakedown (RSDM-S), and Peng et al. [28] by a stress compensation method.
One intrinsic difficulty related to micromechanical analysis of PRMMC materials is that, unlike most fiber reinforced composites, the material often has a random microstructure. As pointed out in many research works [7, 29, 30], predicting material behaviors of PRMMCs from unit cell models or representative volume elements (RVE) having an improper size may lead to strongly biased results. To account for the randomness in the material microstructure and to objectively reflect its influence in the model, one generally acknowledged solution is to employ statistically equivalent representative volume elements (SERVEs) [31]. According to this theory, instead of from one individual RVE, the material behavior should be viewed from a statistical point of view and predicted from a set of SERVE models. One key premise for studying PRMMC materials by SERVEs is to have capable algorithms for creating a sufficient number of samples. In this regards, algorithms such as random sequential absorption and modeling software such as Digimat and Dream3D have greatly reduced the effort required for generating samples and therefore make this strategy a viable means for studying PRMMC materials.
In our previous works [32, 33], an integrated numerical approach for predicting the ultimate strength and endurance limit of PRMMC materials is proposed which incorporates homogenization, direct methods, and statistical analysis. In the present study, this method is extended to the case of high dimensional load space such that the strengths of PRMMCs subjected to superimposed tensile and shear stress can be evaluated. To exhaustively investigate the material behavior under all plausible combinations between two tensile and one shear stresses, a method for generating optimally distributed weight factors in an n dimensional space is developed. Using this method, endurance limit of an exemplary PRMMC material, WC- 30 Wt.% Co, submitted to three stresses is evaluated from many SERVE samples.
2 Direct Method Based Strength Prediction
2.1 Overall Strengths of Heterogeneous Materials
Macroscopic strengths of heterogeneous materials can be predicted by applying direct method to RVE samples. To do this, the material should be considered in two well-separated scales: The microscopic scale \({\varvec{y}}\) in which the RVE exists and the macroscopic scale \({\varvec{x}}\) large enough that the heterogeneities smear out. Two scales are related by a scale parameter \(\delta\)
For a heterogeneous material, once it is subjected to external loading, microscopic stress field \({\varvec{\sigma }}\) and the macroscopic one \({\varvec{\varSigma }}\) satisfy the relationship
Here \(\left\langle \cdot \right\rangle\) stands for the mean-field averaging operator, and \(\varOmega\) indicates the RVE domain. Similarly, the relationship between strains in micro and macro scales satisfy
The microscopic strain \({\varvec{\varepsilon }}\) can be decomposed into two parts: The average value \({\varvec{E}}\) and a fluctuating part \({\varvec{\varepsilon }}^*\)
When the overall behavior of the RVE is purely elastic, then \({\varvec{\varSigma }}\) and \({\varvec{E}}\) are correlated by an effective elastic tensor \(\overline{{\mathbb {C}}}\)
If the material is isotropic in the macro scale, then \(\overline{{\mathbb {C}}}\) can be uniquely determined from effective Young’s modulus \({\bar{E}}\) and effective Poission’s ratio \({\bar{\nu }}\).
Given that the heterogeneous material is composed of elasto-plastic constituents, its global ultimate strength \(\Sigma _U\) and endurance limit \(\Sigma _\infty\) correspond to plastic and shakedown limits, respectively. Here, plastic limit can be viewed as a particular case of shakedown in which the load is only allowed to vary monotonically. The feasible load domain of a material can be calculated from DM by imposing either \({\varvec{E}}\) or \({\varvec{\Sigma }}\) as boundary conditions [9], where the former case refers to the kinematically uniform boundary condition (KUBC) and the latter case the statically uniform boundary condition (SUBC). For a periodic heterogeneous material in the absence of the body force subjected to SUBC, Magoariec et al. [10] proposes a static shakedown condition which requires the stress field associated with the reference elastic body \({\mathcal {B}}^E\), \({\varvec{\sigma }}^e\), and the time invariant residual stress field \(\bar{{\varvec{\rho }}}\) to satisfy
Here, \(\partial \Omega\) refers to the RVE surface, \({\varvec{n}}\) the outer surface normal, and \({\varvec{u}}^*\) the fluctuation part of the displacement corresponds to \({\varvec{\varepsilon }}^*\). Because the material studied in this work is non-periodic, some modifications were made on conditions given in Eqs. (6) and (7): Instead of enforcing the node-wise anti-periodicity of the stresses and periodicity of the fluctuating strain, it is only required \(\left\langle {\varvec{\varepsilon }}^*\right\rangle\) and \(\left\langle \bar{{\varvec{\rho }}}\right\rangle\) to be zero. In other words, when an RVE is subjected to SUBC, \(\left\langle \bar{{\varvec{\rho }}} \right\rangle\) is only required to be divergence free inside \(\Omega\) and have no contribution on the macroscopic stress.
2.2 Generating Optimally-Distributed Weight Factors in an n Dimensional Load Space
In the present study, the aim is to evaluate strengths of RVEs simultaneously subjected to two tensile and one shear stresses, all vary independently. To this end, we introduce in this section a pragmatic algorithm which systematically generates optimally-distributed weight factors in an n dimensional load space.

Load domain \({\mathcal {L}}\) and vertices \({\varvec{P}}_k\)
When an elastic-perfectly plastic structure is submitted to NL independently varying loads \(\hat{{\varvec{P}}}_n({\varvec{x}},t)\), \(\hat{{\varvec{P}}}_n\) can be decomposed into two parts: A time independent base \(\hat{{\varvec{P}}}_{0n}({\varvec{x}})\) corresponds to the load pattern and an associated coefficient \(\mu _i\) describes the load magnitude. This way, as shown in Figure 1, a specific load history \({\mathcal {H}}\) can be defined as
where \({\mathcal {H}}\) is a trajectory in the n dimensional load space \({\mathcal {L}}\)
Here, \(\mu _n^-\) and \(\mu _n^+\) correspond to the lower and upper bound of a loading \(\hat{{\varvec{P}}}_n\), respectively. \({\mathcal {L}}\) is a convex domain with \(NV= 2^n\) vertices. We denote each vertex by \({\varvec{P}}_k\), so k could be any integer between 1 and NV.
Due to the linearity of elastic stresses, \({\varvec{\sigma }}^e\) can be seen as a superposition
As Eq. (10) indicates, for a specific load history, only the magnitudes of loads are varying, thus it is justified to completely focus on coefficients \(\mu _n\). By separating \(\mu _n\) from their original basis \(\hat{{\varvec{P}}}_{0n}\) and merging with the unit basis \({\varvec{e}}_n\), a load magnitude vector \({\varvec{\mu }}\) can be formed. All feasible \({\varvec{\mu }}\) with \(\mu _n \in [\mu _n^-,\mu _n^+]\) constitute a domain
It is evident that an one-to-one mapping can be established between elements in \({\mathcal {L}}\) and \({\mathcal {U}}\). The benefit for introducing \({\mathcal {U}}\) is, that the physical nature of a specific loading becomes unimportant; loadings \(\hat{{\varvec{P}}}_{n}\) differ only by their magnitudes. For simplicity, each basic loading \(\hat{{\varvec{P}}}_{0n}\) should be adjusted to a comparable level, e.g. all correspond to the elastic limit. Then with \(\mu _n\) varying inside \(\mu _n\in [\mu _n^-,\mu _n^+]\), all admissible load combinations can be exhausted.
To illustrate the algorithm for generating \({\varvec{\mu }}\) with the lowest complication, the discussion is restricted to a particular load case where any given load \(\hat{{\varvec{P}}}_n\) is forced to vary within \([{\varvec{0}}, \mu _n^+\hat{{\varvec{P}}}_{0n}]\). In spite of this restriction, it is clear that by replacing 0 in the \(n^{th}\) entry in result by \(\mu _n^-\hat{{\varvec{P}}}_{0n}\), the outlined approach can be easily generalized to account for reversed loading as well. To derive \({\varvec{\sigma }}^e\) at all NV load vertices in an n dimensional load space, we define a matrix \({\varvec{U}} \in {\mathbb {R}}^{NV\times {n}}\) whose each row corresponds to a binary index of a vertex k
Based on \({\varvec{U}}\), a load magnitude vector \({\varvec{\mu }}\) can be converted to a combinatorial matrix \({\varvec{U}}_{\mu } \in {\mathbb {R}}^{NV\times {n}}\)
The purpose of \({\varvec{U}}_{\mu }\) is to superpose stress calculated from each individual loading \(\hat{{\varvec{P}}}_{0n}\) to all NV vertex stresses \({\varvec{\sigma }}^e_k\). To do this, first we arrange stress associated with each basic loading \(\hat{{\varvec{P}}}_{0i}\) in following matrix form
In this equation, \({\varvec{\sigma }}^e(\hat{{\varvec{P}}}_{0n})\) is a column vector consisting of stresses at all NG Gaussian points. When a 3D model is considered, the length of \({\varvec{\sigma }}^e_{i}(\hat{{\varvec{P}}}_{0n})\) is \(6\cdot NG\). Using \({\varvec{\sigma }}^e_B\) introduced in Eq. (14), \({\varvec{\sigma }}^e_{k}\) at all load vertices can be calculated by
In DM, load factor \(\alpha\) is often evaluated for many different combinations of \(\hat{{\varvec{P}}}_i\). As Eq. (13) implies, each combination can be viewed as a polyhedron whose vertices generated from a different \({\varvec{\mu }}\). A challenge in DM is to use the least number of \({\varvec{\mu }}\) to approximate the domain \({\mathcal {U}}\). For two independently varied loads \(\hat{{\varvec{P}}}_{01}\) and \(\hat{{\varvec{P}}}_{02}\) , one simple way to generate a series of \({\varvec{\mu }}\) is introducing an angle \(\theta \in [0,2\uppi ]\)
Similarly, when three independently varying loads \(\hat{{\varvec{P}}}_{01}\), \(\hat{{\varvec{P}}}_{02}\) and \(\hat{{\varvec{P}}}_{03}\) are considered, one can use two angles \(\theta \in [0,\uppi ]\) and \(\varphi \in [0,2\uppi ]\)
Although this approach is simple, it is hard to be generalized to cases \(n > 3\). Meanwhile, the method requires users to specify the values of parameters, e.g., \(\theta\) and \(\phi\) in Eq. (17), therefore when these parameters are inappropriately selected, \({\varvec{\mu }}\)’s will have a severe inhomogeneous distribution in \({\mathcal {U}}\). To remedy such problem, we developed a simple algorithm.
Before illustrating this algorithm, we assume that \(\hat{{\varvec{P}}}_{0n}\) has already been adjusted to a comparable level, in other words, \({\varvec{\sigma }}^e(\hat{{\varvec{P}}}_{0n})\) are in similar magnitudes. Based on this premise, we could fix all \(\mu _n^+\) to 1 and discretize the interval [0, 1] associated to \(\hat{{\varvec{P}}}_{0n}\) to a grid vector \({\varvec{p}}_n\) of the length \(l_n\). Because each \({\varvec{p}}_n\) can be viewed as a set \(\{{\varvec{p}}_n\}\) whose elements are vector’s components, the load set \({\mathcal {U}}\) can be generated by calculating the Cartesian power \({\varvec{p}}_1 \times {\varvec{p}}_2 \times \dots \times {\varvec{p}}_n\). The \({\mathcal {U}}\) generated in such a manner is a set consisting of \(\prod _{i=1}^{n} l_i\) elements where each element represents a vector \({\varvec{\mu }} \in {\mathbb {R}}^n\). It is easy to figure out that many \({\varvec{\mu }}\) in \({\mathcal {U}}\) have different norms but same directions. These vectors are repetitive because their difference in norms can be compensated by the load factor \(\alpha\) calculated from DM. Due to this reason, only vectors differing in terms of directions should be remained in \({\mathcal {U}}\) and the repeating ones should be removed. To do this, as shown in Figure 2 we normalize vectors in \({\mathcal {U}}\) and remove the repeating ones after normalization. It is noteworthy that, after doing this \({\varvec{\mu }}\) in \({\mathcal {U}}\) are no longer evenly distributed. To optimize the distribution, the distance between each paired vector \(\Delta {\varvec{\mu }}\) is evaluated and once \(\Vert \Delta {\varvec{\mu }}\Vert\) drops below a user-defined tolerance \(\epsilon\), two vectors are regarded as identical and one of them is removed from the set (see Figure 2(b)). Using this method, by adjusting parameter \(\epsilon\), one can easily control the size of \(\, {\mathcal {U}}\) and generate the set with optimally distributed \({\varvec{\mu }}\)’s.
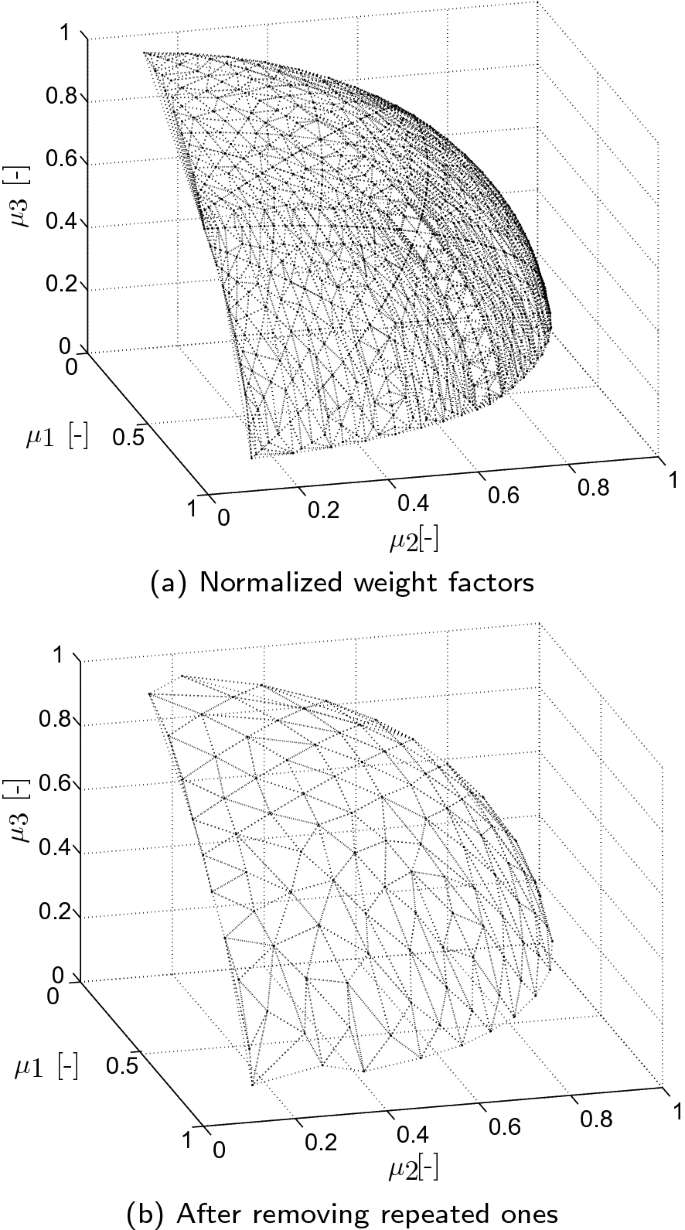
Generation of optimally distributed weight factors
2.3 Optimization Problem from the Static Shakedown Theorem
Employing shakedown conditions outlined in Eqs. (6) and (7) and discretizing the physical fields by FE formulations, the macroscopic strengths of RVEs composed of elastic perfectly plastic materials can be calculated from following optimization problem
Here, \(\alpha\) is the load factor, \({\varvec{C}}\) the equilibrium matrix, \(\bar{{\varvec{\rho }}}_i\) the stress tensor in the \(i^{th}\) Gaussian point, \({\varvec{\sigma }}^e_{ik}\) the abbreviation of \({\varvec{\sigma }}^e_i({\varvec{P}}_k)\) which means \({\varvec{\sigma }}^e\) at Gaussian point i and load vertex k, \(\sigma _Y\) the yield strength, F the yield function. Solving Eq. (18) yields the load capacity of the RVE, and depending on if \(k=1\) or \(k > 1\) the calculated strength corresponds to either ultimate strength \(\Sigma _U\) or endurance limit \(\Sigma _\infty\).
Following steps elucidated in our previous work [32] problem Eq. (18) can be transformed into an equivalent one whose inequality constraints are Euclidean ball constraints. Since after this transformation the problems obtained are typical second-order cone programming (SOCP) problems, they can be solved efficiently using commercial optimization solvers such as Gurobi [34], CPLEX [35], MOSEK [36], among others. In the present study, solver Gurobi is employed to calculate strengths of RVE for cases \(NV=\) 1, 2 and 8 by solving optimization problems. Here, \(NV=1\) yields the ultimate strength \(\Sigma _U\), \(NV=2\) the endurance limit under proportionately varied three loads \(\Sigma _\infty ^{2P}\), and \(NV=8\) the endurance limit under disproportionately varied three loads \(\Sigma _\infty ^{8P}\).
3 Numerical Results
3.1 Configuration of FE Models
In the present study, an exemplary PRMMC material, WC - 30 Wt.% Co, was chosen, and by adopting the numerical approach explained above we studied its mechanical behaviors under two tensile and one shear stresses. Microstructures of WC - 30 Wt.% Co are similar to the scanning electron microscope (SEM) image shown in Figure 3 where the dark grey areas are Co and the bright areas are the WC-grains with their characteristic prismatic shape. The average size of carbide phase is \(d_{\text {WC}}\) = 2.35 \(\upmu\)m. Using a modeling technique developed in-house, fifty SEM images were cropped to 40 \(\upmu\)m \(\times\) 40 \(\upmu\)m squares and converted to FE models. All these models share a same mesh pattern: Elements distant from the phase boundaries were assigned a global size of 0.8 \(\upmu\)m and elements close to the phase boundaries with an edge length of 0.2 \(\upmu\)m. Meanwhile, as has been highlighted in our previous work [32], on the one hand, 3D models demand a huge amount of computational power to be calculated and therefore are too expensive for a statistical analysis, while on the other hand both plane strain and plane stress models make extreme idealizations of the material behavior in z direction and show a nontrivial mesh sensitivity. For these reasons, due to its limited modeling complexity and insignificant mesh size dependence, 2.5D models obtained by extracting 2D models for 1 \(\upmu\)m in the z direction were employed for the present study. Meanwhile, the study is restricted to the infinitesimal strain theory and consider both phases as von Mises materials with parameters summarized in Table 1.

SEM image of the PRMMC material WC- 30 Wt.% Co
To perform shakedown analysis and determine overall strengths of SERVE samples, elastic analyses were performed in the commercial FE code ABAQUS. In these analyses, as illustrated in Figure 4 all fifty samples were successively prescribed with global stresses \(\Sigma _{11}\), \(\Sigma _{22}\) and \(\tau _{12}\) by means of SUBC and the elastic stress field under each load case was evaluated. Employing these stress fields and other key model information such as the shape function and node coordinates we constructed the shakedown problems Eq. (18) at 44 load combinations whose weight factors are calculated from the aforementioned algorithm. By solving these problems considering one, two or eight load vertices, for each sample three feasible load domains corresponding to \(\Sigma _U\), \(\Sigma _\infty ^{2P}\) and \(\Sigma _\infty ^{8P}\) were obtained.

FE mesh and load conditions for SERVE samples
3.2 Statistical Analysis of Elastic Properties
Before analyzing the strengths of RVE samples, we first evaluated results gained from elastic analyses. The purpose for studying elastic behaviors is twofolds: Firstly, a careful and thorough investigation of elastic responses of SERVE samples to the global shear stress is the premise for understanding their performances, especially the load bearing capacities, under shear and superposed tensile and shear stresses. Secondly, in reality WC - 30 Wt.% Co is an isotropic material, which means it has only two independent elastic parameters. Therefore, by comparing the effective shear modulus obtained from the mean-field homogenization \({\bar{G}}\) with the one calculated from \({\bar{E}}\) and \({\bar{\nu }}\) and denoted as \({\bar{G}}^*\), one may know the degree of sample anisotropy and infer from this value if they satisfy basic model requirements.
Figure 5 shows the statistical distribution of carbide volume fraction WC Vol.%, \({\bar{E}}\) and \({\bar{G}}\). In this figure r stands for the Pearson correlation coefficient and the proximity of r to one implies that both \({\bar{E}}\) and \({\bar{G}}\) are determined by the carbide content. Result of the comparative study between shear moduli obtained from two distinct approaches is illustrated in Figure 6. In this figure \(|\delta |\) is the relative discrepancy defined as \(|\delta |=| {\bar{G}}^*-{\bar{G}}|/{\bar{G}}\). Figure 6 shows that the difference between \({\bar{G}}^*\) and \({\bar{G}}\) is insignificant for all SERVE samples. The fact that \(|\delta |\) is no greater than 2.0% for all samples implies that all these models demonstrate a sound global isotropy. For this reason, it is justified to conclude that they satisfy the basic size requirement and therefore can be used to study more sophisticated nonlinear material behaviors.

Correlation between homogenized elastic properties

Discrepancy between shear moduli calculated from two approaches
3.3 Statistical Analysis of Composite Strengths
The average feasible load domain calculated from fifty SERVE samples can be found in Figure 7. In this figure all macroscopic strengths were normalized with respect to the binder yield limit in order to emphasize the strengthening effect of carbide particles. One can easily notice from this figure that in both \(\Sigma _{11}-\tau _{12}\) and \(\Sigma _{22}-\tau _{12}\) planes, \(\Sigma _{\infty }^{2P}\) overlaps with \(\Sigma _{\infty }^{8P}\). The reason behind this phenomenon can be explained as follows: Failure of all samples is caused by the stress state at \({\varvec{P}}_1\) in Figure 1, since this vertex plays a dominant role, as a consequence it does not make any difference if the tensile and shear stresses have to be proportional or independently. The slight difference between \(\Sigma _{\infty }^{2P}\) and \(\Sigma _{\infty }^{8P}\) is attributed to the fixed solver configuration parameters: The optimization problem Eq. (18) considering two and eight load vertices are remarkably different in terms of both variables and constraints, hence it is unavoidable that solutions for two cases are slightly different when adopting the same termination criterion. In the \(\Sigma _{11}-\Sigma _{22}\) plane \(\Sigma _{\infty }^{2P}\) is remarkably smaller than \(\Sigma _{\infty }^{8P}\), especially in the region close to the \(\uppi /4\) line. As explained in Ref. [32], this phenomenon is caused by the fact that when \(\Sigma _{11}\) and \(\Sigma _{22}\) vary proportional, they result in a hydrostatic stress which does not directly contribute to the overall strength.

Averaged feasible load domain

Projection of the load domain on three planes
Besides the mean value, the scatter of strengths among SERVE samples were evaluated as well and summarized in Figure 8. In this figure the interval between \([-2SD, 2SD]\) where SD stands for the standard deviation is illustrated as a colored band. Since width of a colored band reveals how great the impact of a microstructure is, it is clear that with the increase of NV the influence of microstructure becomes less critical. The relationship between volume fraction and strengths of different kinds can be found in Figure 9. One can notice from this figure that, unlike elastic modulus, strengths of the PRMMC samples are not strongly correlated to the carbide volume fraction. Meanwhile, one can see that r between \(\Sigma _{U}\) in 11 and 22 directions is 0.47, while r between \(\Sigma _{\infty }\) in two direction becomes 0.70. It means, compared to ultimate strengths, endurance limits of samples subjected to normal stresses in 11 and 22 directions are apparently more similar. This again confirms the finding that the microstructure has a greater influence on the material strength in the context of a monotonic load than a time-varied load. Another noteworthy phenomenon in Figure 9 is that for both \(\Sigma _{U}\) and \(\Sigma _{\infty }\), the correlation between tensile and shear stresses is insignificant. This implies that a microstructure results in an outstanding tensile strength does not necessarily results in an outstanding shear strength.

Correlation between strengths of different types

Stress fields in samples with different \(Z_{\tau _{\infty }}\)
To understand what are the main factors determining the shear strength of the PRMMC material, we compared stress fields obtained from the DM calculation between SERVE samples having poor and excellent shear strengths. As can be noticed from Figure 10, the distribution pattern of total stress \({\varvec{\sigma }}=\alpha {\varvec{\sigma }}^e+\bar{{\varvec{\rho }}}\) at vertex \({\varvec{P}}_1\) are remarkably different for two SERVE samples. For the sample having a poor shear strength whose Z-score, \(Z_{\tau _{\infty }}\), is merely −2.82, the distribution of normalized effect stress is quite localized. It means that the overall deformation concentrates in a weakest region consisted almost completely of the binder phase when the sample is subjected to a global stress. Undoubtedly for a sample whose deformation is dominated by such a mechanism, the reinforcement particles can hardly contribute and, as a consequence, the overall strength of the sample is poor. In contrast to these samples, for models in which such a weakest region is not obvious, a higher fraction of the overall volume would be stressed. Under such circumstance, the carbide particles would come into effect and the sample would have a higher strength.

Contour maps of feasible load domains
To further investigate how SERVE samples react to superposed tensile and shear stresses, we separated the loads to two groups and considered shear stress as an addition to two tensile stresses. Adopting this point of view, we viewed 3D feasible load domain by means of contour maps. As shown in Figure 11, each contour line in such a map corresponds to a 2D load domain with a shear stress whose magnitude is displayed. Figure 11(a) corresponds to Figure 7 viewed from above, and Figure 11(b) shows load domains for a randomly picked sample. Contour maps reveal how strength under two tensile stresses change in accordance to the additionally imposed shear stress. These figures can be interpreted as a trade-off between two tensile and one shear stresses. One noteworthy characteristic pertained to Figure 11 is that the transition of contour lines alongside increase of \(\tau\) is fairly steady: The shape of contour lines are well preserved, and the rate of their shrinkage for all combinations of \(\Sigma _{11}\) and \(\Sigma _{22}\) are alike. Such a characteristic can help with simplifying the strengths prediction practice of materials similar to WC - 30 Wt.%. One should bear in mind that although by adopting the numerical method elaborated in the present work the entire feasible load domain under three combined tensile and shear stresses can be calculated, the required computational power for solving shakedown problems in 3D load space is still much greater compared to 2D. For this reason, when instead of the accurate value it is only important to know how the load domain varies with the additional shear stress, then the effort for solving DM problems with eight vertices can be saved and one can simply calculate three 2D load margins and extrapolate them to a 3D surface.
4 Conclusions
In this paper, the numerical approach for predicting the strengths of PRMMCs is extended to take into account of independently varied two tensile and one shear stresses. A general algorithm is proposed to generate optimally distributed weight factors in an n dimensional load space. Based on this algorithm the study calculated ultimate strengths and endurance limits of fifty 2.5D SERVE samples modeled from real SEM image of WC- 30 Wt% Co. Through studying the statistical characteristics of results, the study shows that shear strength is only subtly related to both tensile strength and carbide contents, while the magnitude of the shear strength is determined by the highly stressed volume fraction. In addition, by investigating the load domains by means of contour maps the study suggests to decouple the superposed loads and simplify a shakedown problem in 3D load space to three problems in 2D load space. In the present study, the failure mode is restricted to the plastic failure and defects such as micro pores introduced during the sintering process are neglected, the influence of these factors on material strength will be investigated in our future studies.
Availability of Data and Materials
The datasets generated during and/or analysed during the current study are not publicly available but are available from the corresponding author on reasonable request.
References
Qing, H. The influence of particle shapes on strength and damage properties of metal matrix composites. Journal of Nanoscience and Nanotechnology, 2015, 15: 5741–5748. https://doi.org/10.1166/jnn.2015.10307.
Z Li, P Wang, Q Shan, et al. The particle shape of WC governing the fracture mechanism of particle reinforced iron matrix composites. Materials, 2018, 11: 984. https://doi.org/10.3390/ma11060984.
Y Wei. Particulate size effects in the particle-reinforced metal-matrix composites. Acta Mechanica Sinica, 2001, 17(1): 45. https://doi.org/10.1007/BF02487769.
J F Zhang, H Andrä, X X Zhang, et al. An enhanced finite element model considering multi strengthening and damage mechanisms in particle reinforced metal matrix composites. Composite Structures, 2019, 226: 111281. https://doi.org/10.1016/j.compstruct.2019.111281.
A Abedini, B Cliff, Z Chen. Numerical simulation of the influence of particle clustering on tensile behavior of particle reinforced composites: Study of shape of the particles. Computational Materials Science, 2013, 73: 15–23. https://doi.org/10.1016/j.commatsci.2013.02.021.
J Nafar Dastgerdi, B Anbarlooie, A Miettinen, et al. Effects of particle clustering on the plastic deformation and damage initiation of particulate reinforced composite utilizing X-ray CT data and finite element modeling. Composites Part B: Engineering, 2018, 153: 57–69. https://doi.org/10.1016/j.compositesb.2018.07.027.
H K Park, J Jung, H S Kim. Three-dimensional microstructure modeling of particulate composites using statistical synthetic structure and its thermo-mechanical finite element analysis. Computational Materials Science, 2017, 126: 265–271. https://doi.org/10.1016/j.commatsci.2016.09.033.
J Zhang, Q Ouyang, Q Guo, et al. 3D microstructure-based finite element modeling of deformation and fracture of SiCp/Al composites. Composites Science and Technology, 2016, 123: 1–9. https://doi.org/10.1016/j.compscitech.2015.11.014.
D Weichert, A Hachemi, F Schwabe. Application of shakedown analysis to the plastic design of composites. Archive of Applied Mechanics, 1999, 69(9–10): 623–633.
H Magoariec, S Bourgeois, O D´ebordes. Elastic plastic shakedown of 3D periodic heterogeneous media: A direct numerical approach. International Journal of Plasticity, 2004, 20(8): 1655–1675.
S Bourgeois, H Magoariec, O Débordes. A direct method for the determination of effective strength domains for periodic elastic-plastic media. In: Limit states of materials and structures, Springer, 2009: 67–86.
H Zhang, Y H Liu, B Y Xu. Plastic limit analysis of ductile composite structures from micro-to macro-mechanical analysis. Acta Mechanica Solida Sinica, 2009, 22(1): 73–84.
J H You, B Y Kim, M Miskiewicz. Shakedown analysis of fibre-reinforced copper matrix composites by direct and incremental approaches. Mechanics of Materials, 2009, 41(7): 857–867.
M Chen, A Hachemi. Progress in plastic design of composites. In: K Spiliopoulos, D Weichert, eds. Direct methods for limit states in structures and materials, Springer, 2014: 119–138.
J Zhang, W Q Shen, A Oueslati, et al. Shakedown of porous materials. International Journal of Plasticity, 2017, 95: 123–141. https://doi.org/10.1016/j.ijplas.2017.04.003.
J Zhang, A Oueslati, W Q Shen, et al. Shakedown analysis of a hollow sphere by interior-point method with non-linear optimization. International Journal of Mechanical Sciences, 2020, 175: 105515. https://doi.org/10.1016/j.ijmecsci.2020.105515.
V Carvelli. Shakedown analysis of unidirectional fiber reinforced metal matrix composites. Computational Materials Science, 2004, 31(1–2): 24–32.
H F Chen, A R S Ponter. On the behaviour of a particulate metal matrix composite subjected to cyclic temperature and constant stress. Computational Materials Science, 2005, 34(4): 425–441.
O Barrera, A C F Cocks, A R S Ponter. The linear matching method applied to composite materials: A micromechanical approach. Composites Science and Technology, 2011, 71(6): 797–804.
H X Li. A nonlinear programming approach to limit analysis of non-associated plastic flow materials. Mathematics and Mechanics of Solids, 2013, 18(5): 524–542. https://doi.org/10.1177/1081286512444749.
H X Li. A microscopic nonlinear programming approach to shakedown analysis of cohesive–frictional composites. Composites Part B-Engineering, 2013, 50: 32–43.
C V Le, P H Nguyen, H Askes, et al. A computational homogenization approach for limit analysis of heterogeneous materials. International Journal for Numerical Methods in Engineering, 2017, 112(10): 1381–1401. https://doi.org/10.1002/nme.5561.
H Qing. 2D micromechanical analysis of SiC/Al metal matrix composites under tensile, shear and combined tensile/shear loads. Materials & Design, 2013, 51: 438–447. https://doi.org/10.1016/j.matdes.2013.04.051.
H Qing, T L Liu. Micromechanical analysis of SiC/Al metal matrix composites: Finite element modeling and damage simulation. International Journal of Applied Mechanics, 2015, 7(2): 1550023.
B Y Kim, J H You. Three-dimensional shakedown analysis of fiber-reinforced metal matrix composite (FRMMC) layered plasma-facing component for high heat flux loading. Proceeding of the 25th Symposium on Fusion Technology, Fusion Engineering and Design, 2009, 84(2): 1033–1037.
J W Simon, D Weichert. Shakedown analysis with multidimensional loading spaces. Computational Mechanics, 2012, 49(4): 477–485.
K V Spiliopoulos, K D Panagiotou. An enhanced numerical procedure for the shakedown analysis in multidimensional loading domains. Computers & Structures, 2017, 193: 155–171.
H Peng, Y H Liu, H F Chen, et al. Shakedown analysis of engineering structures under multiple variable mechanical and thermal loads using the stress compensation method. International Journal of Mechanical Sciences, 2018, 140: 361–375.
T Kanit, S Forest, I Galliet, et al. Determination of the size of the representative volume element for random composites: Statistical and numerical approach. International Journal of Solids and Structures, 2003, 40(13): 3647–3679.
X X Zhang, B L Xiao, H Andrä, et al. Homogenization of the average thermo-elastoplastic properties of particle reinforced metal matrix composites: The minimum representative volume element size. Composite Structures, 2014, 113: 459–468.
S Swaminathan, S Ghosh, N J Pagano. Statistically equivalent representative volume elements for unidirectional composite microstructures: Part I-Without damage. Journal of Composite Materials, 2006, 40(7): 583–604.
G Chen, A Bezold, C Broeckmann, et al. On the statistical determination of strength of random heterogeneous materials. Composite Structures, 2016, 149: 220–230.
G Chen, L Zhang, A Bezold, et al. Statistical investigation on influence of grain size on effective strengths of particulate reinforced metal matrix composites. Computer Methods in Applied Mechanics and Engineering, 2019, 352: 691–707.
Inc., G.O.: Gurobi Optimizer Reference Manual (2019). http://www.gurobi.com.
CPLEX, IBM ILOG: V12.10. User’s manual for CPLEX. International Business Machines Corporation, 2019.
E D Andersen, K D Andersen. The Mosek interior point optimizer for linear programming: An implementation of the homogeneous algorithm. In: H Frenk, K Roos, T Terlaky, eds. High performance optimization: Applied optimization, Springer, 2000, 33: 197–232.
Acknowledgements
The authors gratefully acknowledge reviewers for spending time reading this work and giving insightful suggestions.
Funding
Supported by the National Natural Science Foundation of China (Grant No. 52075033) and Fundamental Research Funds for the Central Universities of China (Grant No. 2020RC202).
Author information
Authors and Affiliations
Contributions
GC: conceptualization; development of methodology; designing computer programs; writing—original draft preparation, funding acquisition. SX: performing the simulation; preparation of data presentation and visualization; conducting results analysis and validation. LZ: conceptualization; computing resources; project administration; writing—review and editing. CB: conceptualization; laboratory resources. All authors discussed the results and contributed to the final manuscript. All authors read and approved the final manuscript.
Corresponding author
Ethics declarations
Competing Interests
The authors declare that they have no competing interests.
Rights and permissions
Open Access This article is licensed under a Creative Commons Attribution 4.0 International License, which permits use, sharing, adaptation, distribution and reproduction in any medium or format, as long as you give appropriate credit to the original author(s) and the source, provide a link to the Creative Commons licence, and indicate if changes were made. The images or other third party material in this article are included in the article's Creative Commons licence, unless indicated otherwise in a credit line to the material. If material is not included in the article's Creative Commons licence and your intended use is not permitted by statutory regulation or exceeds the permitted use, you will need to obtain permission directly from the copyright holder. To view a copy of this licence, visit http://creativecommons.org/licenses/by/4.0/.
About this article

Cite this article
Chen, G., Xin, S., Zhang, L. et al. Statistical Analyses of the Strengths of Particulate Reinforced Metal Matrix Composites (PRMMCs) Subjected to Multiple Tensile and Shear Stresses. Chin. J. Mech. Eng. 34, 142 (2021). https://doi.org/10.1186/s10033-021-00660-6
Received:
Revised:
Accepted:
Published:
DOI: https://doi.org/10.1186/s10033-021-00660-6