- Original Article
- Open access
- Published:
Fatigue Characterization on a Cast Aluminum Beam of a High-Speed Train Through Numerical Simulation and Experiments
Chinese Journal of Mechanical Engineering volume 34, Article number: 108 (2021)
Abstract
The cast aluminum beam is a key structure for carrying the body-hung traction motor of a high-speed train; its fatigue property is fundamental for predicting the residual life and service mileage of the structure. To characterize the structural fatigue property, a finite element-based method is developed to compute the stress concentration factor, which is used to obtain the structural fatigue strength reduction factors. A full-scale fatigue test on the cast aluminum beam is designed and implemented for up to ten million cycles, and the corresponding finite element model of the beam is validated using the measured data of the gauges. The results show that the maximum stress concentration occurs at the fillet of the supporting seat, where the structural fatigue strength reduction factor is 2.45 and the calculated fatigue limit is 35.4 MPa. Moreover, no surface cracks are detected using the liquid penetrant test. Both the experimental and simulation results indicate that the cast aluminum beam can satisfy the service life requirements under the designed loading conditions.
1 Introduction
For a high-speed train (HST) equipped with body-hung traction motors, cast aluminum beams are usually employed as the main load-bearing structures of the vehicle drive systems. To analyze the fatigue properties of such large and complex structures, the S–N curve-based nominal stress method is widely used in industrial applications. This method considers that structures with the same stress concentration factor, material, and manufacturing process, have the same fatigue life provided the local stress spectra are equal. The nominal stress method is simple to use because stresses can be calculated or tested from a certain structure or specimen. For example, it is suitable for the fatigue strength assessment of complex welded joints [1] and the fatigue behavior prediction of notched specimens under different load conditions [2, 3]. For railway vehicle car bodies, bogies, or other load-carrying structures, the design life should be a minimum of 30 years [4, 5]. To ensure that the service life of these structures can be covered by the design life, fatigue loads up to \(10^{7}\) cycles are usually conducted in structural tests. Regarding experimental studies of the full-scale components, Song et al. [6] proposed an equivalent load method to simulate the partial response of the entire car-body, which allows the reproduction of track induced vibrations to be conducted in the laboratory; Sung et al. [7] presented a dynamic load testing method by considering the loads transferred from the bogie system, which demonstrate the feasibility of filling the gap left by the constant stress range assumption of the static test method; Makino et al. [8] illustrated that the stress concentration significantly affects the fatigue property of the HST axles by combining the experiments and numerical simulations. As mentioned above, for large components or structures as those working in complex load conditions, an experimental study is necessary to monitor the stress state regarding the loads or validate the simulation results.
The S–N curves of the benchmark specimens show the relationship between the stress and the number of load cycles when fatigue failure occurs, where S is the stress amplitude (stress ratio R = −1) or the maximum stress (\(R \in {(0, 1)}\)), and N represents the number of load cycles under the present stress level. Based on a certain number of fatigue tests, Basquin, Langer, and three-parameter models are widely used to plot the S–N curves of the specimens in high-cycle fatigue issues [9]. However, the fatigue properties of materials obtained via benchmark specimens are insufficient to express those of a complex structure, which is determined simultaneously by the stress concentration, structural size, and manufacturing process [10]. To characterize the real-life model of a component or structure, the fatigue strength reduction factor \(K_{D}\) is introduced to modify the empirical S–N curves through the aforementioned three factors. Herein, \(K_{D}\) is a smooth-to-notched specimen fatigue strength ratio, where the fatigue life of the structures [11] can be evaluated effectively. When \(K_{D}\) is used to analyze the structural fatigue property, the size and process factors can be cited in mechanical handbooks [12]. However, the stress concentration, which is the dominant factor, depends on the method used in the analysis, for example, analytical formulas or numerical solutions. Owing to the limitations of analytical approaches, the finite element (FE)-based method provides a feasible way to calculate the stress concentration factor \(K_{t}\) of a complex structure. For global-local analysis, Cormier et al. [13] and Curreli et al. [14] used a sub-model technology to analyze the stress concentration; however, they did not clarify the calculation of the nominal stress in the components. For structures with various shapes or sizes, for example, H-shaped specimens, welding seams, T-joints, or structures such as subway bolsters [15,16,17,18], stress concentration analysis is still a priority in fatigue characterization.
The aforementioned studies show that experiments and numerical analysis are key measures for demonstrating the load-bearing characteristics of large and complex structures, especially to thoroughly analyze the stress state in critical zones. In terms of the fatigue characterization of practical structures, the stress state affecting the fatigue strength reduction factor should be appropriately analyzed. However, unlike a specimen with a simple configuration, for which it is possible to find an analytical expression of \(K_{t}\), the nominal stress of the complex structures is difficult to obtain through numerical methods. Therefore, the net section can be introduced as a conservative value to calculate the nominal stress using the FE solution tools. In this study, an FE-based method for calculating \(K_{t}\) is developed; here, the cut-off point is determined by the stress gradient. Figure 1 demonstrates the workflow for characterizing the fatigue property of a cast aluminum beam, in which the fatigue strength reduction factor \(K_{D}\) is employed. Combined with the material S–N curve extrapolated through the 2m–1 method [19], the fatigue limit of the beam under bearing conditions was analyzed. Additionally, a ten million cycle-fatigue test of a full-scale beam was carried out, and the potential surface cracks were examined using a liquid penetrant tes
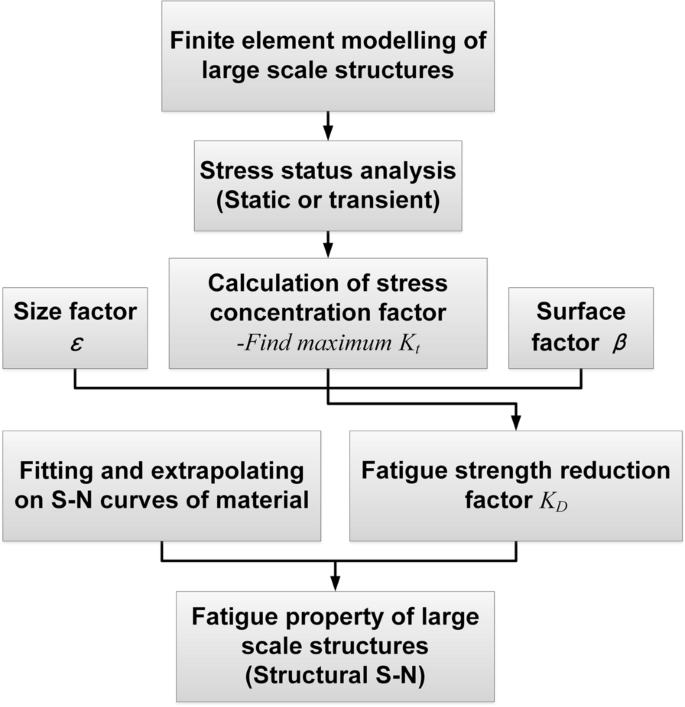
Workflow of fatigue characterization on a large-scale structure
2 FE-Based Method for Calculating the Stress Concentration Factor
To estimate the structural fatigue strength, a series of factors called Marin factors [20] are usually introduced to adjust it to match the actual part. In terms of these factors, the size and surface condition [10] are the main factors that describe the fatigue strength reduction \(K_{D}\), as follows:
where \(K_{f}\) is the effective stress concentration factor (fatigue notch coefficient), which is a reduced value of \(K_{t}\) considering the non-full sensitivity of some materials to the notch. The factor \(\varepsilon\) represents the non-uniformity of the material properties due to size, which is dominated by the diameter of a local part, area of stress pattern, face width, etc. The surface factor \(\beta\) depends on the quality of the surface finish (e.g., ground, cold-drawn, cast, and machined).
Practically, the factors \(\varepsilon\) and \(\beta\) can be selected or determined by empirical formulas or handbook indices to predict the fatigue strength of complex structures [12]. Neuber’s method [21] provides the relation between key factors \(K_{f}\) and \(K_{t}\), as follows:
where \(a\) is a constant value related to the material properties, \(r\), and is the characteristic radius of the notch. Furthermore, a sensitivity coefficient \(q\) is introduced to describe the relationship between \(a\) and \(r\) as follows:
Subsequently, Eq. (2) can be written as
where \(q\) varies in the range of (0, 1). The sensitivity coefficient usually depends on a large number of notched specimen tests. When approaching zero, it indicates that the material is insensitive to the notch owing to the stress concentration relief of the plastic deformation of the microstructures [22]. Conversely, \(K_{f}\) yields \(K_{t}\) when \(q = {1}\); the material is extremely sensitive to the notch. \(K_{t}\) is usually defined as
where \(\sigma_{{{\text{max}}}}\) is the maximum stress at the notch, and \(\sigma_{{{\text{nom}}}}\) is the nominal stress at the cross-section.
To calculate \(K_{t}\), the large-scale complex structure in Eq. (5), \(\sigma_{{{\text{max}}}}\) and its position can be computed directly using the FE solutions. To calculate \(\sigma_{{{\text{nom}}}}\), the stress gradient \(\nabla \sigma\) is introduced to determine the cut-off point along the defined integral path, as shown in Figure 2. In this way, a numerical-based method for determining \(K_{t}\) can be summarized as follows:

FE-based calculation on stress concentration of a notched specimen
(1) At the edge of the notch, the point with the maximum stress is searched, \(\sigma_{{{\text{max}}}}\); an integral path along the normal line of the notch is defined via the direction determined by the notch curves, which is divided into n segments. The size of the segments should be less than the minimum element length, and the coordinates of each point are represented by \(u{(}x_{{n + {1}}} {,}\;y_{{n + {1}}} {,}\;z_{{n + {1}}} {)}\) Cartesian coordinates.
(2) To interpolate the stress on each node along the path, the nearest neighbor interpolation algorithm [23] is implemented based on the nodal results of the FE simulation. In terms of the interpolation, a starting point from \(u{(}x_{{n + {1}}} {,}\;y_{{n + {1}}} {,}\;z_{{n + {1}}} {)}\) is selected first, and then moves to the nearest nodal coordinates \(v{(}x^{\prime}_{m} {,}\;y^{\prime}_{m} {,}\;z^{\prime}_{m} {)}\) with the smallest weight. The interpolated stress value can be expressed as follows:
where \(\sigma {(}x_{{n + {1}}} {,}\;y_{{n + {1}}} {,}\;z_{{n + {1}}} {)}\) is the interpolated stress value at point, \(u{(}x_{{n + {1}}} {,}\;y_{{n + {1}}} {,}\;z_{{n + {1}}} {)}\) and \(\sigma {(}x^{\prime}_{m} {,}\;y^{\prime}_{m} {,}\;z^{\prime}_{m} {)}\) are the nodal stresses at node \(v{(}x^{\prime}_{m} {,}\;y^{\prime}_{m} {,}\;z^{\prime}_{m} {)}\). For the nearest-neighbor interpolation, the employed kernel is
In this case, we can calculate \(\nabla \sigma\) at each segment using the following equation:
(3) To determine the cut-off point on the integral path, a condition \(\nabla \sigma \to {0}\) (i.e., the stress curve tends to be horizontal) is introduced. Moreover, the fatigue property of a large and complex structure is influenced by multiple factors, and the presented workflow is a net-section-based method, in which \(K_{t}\) is relatively conservative compared to the gross-section method.
3 Fatigue Test
According to the literature, the fatigue property of a large structure is usually assessed by a standard-based fatigue test, especially for rail vehicles. In this study, a full-scale cast aluminum beam of HST was implemented to test the potential fatigue crack propagation, and a detailed analysis of the stress state of the structure was validated through experimental results.
3.1 Load Conditions and Setup
In engineering practice, two cast aluminum beams in pairs carry a single traction motor; their upper ends are connected to the underframe of the car body. To evaluate the fatigue property of the beam, a full-scale structure supplied by CRRC Changchun was used in the fatigue test. Figure 3 shows the test setup. To conveniently install the loads on the supporting seats via the jigs, the initial stress caused by gravity is ignored, and the ends of the four hanging brackets are constrained upside down on the base. The loads on the beam are generated by six electro-hydraulic actuators in three directions and controlled by a multi-channel coordinated loading system, in which force sensors are used to monitor the actual forces at the loading positions. Two 5-ton actuators were employed to implement the dominant loads in the vertical direction, which were similar to the spring loads induced by the vibration of the traction motor. Four 2-ton actuators working in the other two directions were installed to generate the loads in curve negotiation conditions.

Tooling for the fatigue test of the cast aluminum beam and setup
Referring to the vibration and fatigue tests mentioned in the industrial standard IEC61373 [24], the loading mode with constant amplitude cycles is derived from the beam structure (see Table 1). Three-directional forces were synchronously subjected to supporting seats with 5 Hz sinusoidal inputs. Figure 4 illustrates a portion of the loading curves employed in the test.

Input waveform of three-directional loads in the fatigue test
Considering the inconvenience of installing strain gauges at all potential weak points (e.g., the inner ribs of the hollow beam structure, the fillets or holes with significant stress concentration), twenty metal-foil strain gauges including 14 normal ones and six rosette gauges, were installed on the concerned areas (see Figure 5). Because the loads acting on the structure are non-axisymmetrical, the gauges are fixed symmetrically on the left and right sides to monitor the response. Additionally, rosette gauges are considered in areas with geometric irregularities, such as the supporting seats and ends of the hanging brackets, where there are uncertainties on the principal directions.

Locations of the installed twenty gauges (R# represents the rosette gauges, S# indicates the normal ones)
3.2 Experimental Results
In terms of the stress response in one load cycle, the gauges installed at the neck of the hanging bracket such as S2 exhibit a maximum stress of value 13.7 MPa; the second-highest stress of 11.7 MPa is monitored by gauge R4, which is bonded at the root of the supporting seat. The stress amplitudes at the two gauges above are 8.2 MPa and 4.55 MPa, respectively. Generally, the measured data from the installed gauges showed a relatively low stress. More comparisons of the experimental and simulation results are discussed in Section 4.
A typical liquid penetrant test (LPT) was conducted according to the standard to detect surface cracks on the beam before and after the fatigue test [25]. In this test, a liquid with high surface wetting characteristics was sprayed on the outer surface of the beam, and any discontinuities, such as surface cracks or defects, become apparent. For the initial state of the beam, there are no surface cracks but three cast shrinkage cavities are detected, which exist at the center of the beam and on one side of hanging bracket #3 (see Figure 6). After ten million cycles of fatigue testing under the designed loads, no visible cracks were observed through the LPT. Furthermore, no crack propagation was found at the shrinkage cavities, which were far from the high-stress zones such as the supporting seats.

Liquid penetrant test on the cast aluminum beam
4 FE Analysis of the Cast Aluminum Beam
4.1 FE Modelling
The cast aluminum beam has a complex geometry, and several stiffener ribs are designed inside the hollow structure to enhance the bearing capacity. An FE model of the beam was established to monitor the dynamic response under the same load condition as that used in the fatigue test. To obtain reasonable results in the critical zones, adaptive gradual grid refinement with a growth rate of 1.3 was employed in the areas with stress concentration. However, some non-bearing accessory structures, such as hangers and bolt holes far from the critical zones, are simplified or omitted to reduce the computational cost, as shown in Figure 7.

FE model of the cast aluminum beam: a Global view; b Local zoom I—supporting seat #1; c Local zoom II—mesh refinement in the fillet of the supporting seat
In this model, the maximum element size is approximately 10 mm, which is implemented to discretize the hanging brackets and the central part, and the minimum element size used in the critical zones, such as the casting fillets of the supporting seats, is approximately 0.05 mm. Tetrahedral solid elements, the type of which is SOLID185 in ANSYS, were adopted for mesh discretization. Finally, 1341092 elements and 289936 nodes were involved in this model, and a transient solver was employed in the simulation. Furthermore, to ensure that the numerical results via the presented method are essentially mesh-independent to mesh densities, we examined coarse elements with sizes of 0.1 mm and 0.2 mm, and a refined mesh size of 0.01 mm in the critical zones (see Figure 7c). In this study, the simulation took approximately 8 h of computational time running on a 12-parallel-thread, 64 GB RAM workstation.
4.2 Comparison of Simulation and Experiment Results
Figure 8 shows the stress contour plots of the beam at four selected moments. In one load cycle, the maximum Von-Mises stress (34.7 MPa) occurs in the fillet of the supporting seat. Because of the use of large radius arcs, the stress of the inner ribs is no more than 10.2 MPa. Additionally, the stress in the central area keeps a low level (< 1 MPa), which indicates that this part is not the main load-carrying zone. However, the supporting seats and hanging brackets show a relatively higher stress, which is consistent with the experimental results shown in Section 3.2.

Von-Mises stress contour of the cast aluminum beam under cyclic loading
To compare the peak values of the simulation and experimental results under the combined sinusoidal loads, the nodal stresses at the positions corresponding to the sites of the gauges were exported. Figure 9 shows the maximum and minimum stresses at the aforementioned positions. The maximum absolute error (< 2.5 MPa) occurs at gauge S5, and the average absolute error of all the measured data is no more than 0.2 MPa. Generally, the simulation and experimental results are in good agreement, which also indicates that the accuracy of the numerical model is suitable for further detailed analysis.

Stress comparisons between FE simulation and fatigue test: a maximum stress; b minimum stress in one load cycle
4.3 Calculation of Fatigue Strength Reduction Factor
According to the simulation results, the fillet of the supporting seat shows the highest stress concentration, where the curvature is approximately 1.5 mm. This is mainly because the supporting seats are in cantilever beam-like loading conditions, where an approximately uniaxial tensile stress state is found in the root (see Figure 10). The vertical load caused by the dead weight and vibration of the traction motor dominates the stress state in the fillet.

Stress concentration analysis of the beam, as obtained from numerical simulation with ANSYS: a Stress contour; b local zooming of the fillet
Figure 11 shows the stress curves along the integral path using different mesh densities. The maximum stress at the edge of the fillet tends to converge with the increase in density. Specifically, meshes discretized with an element size of 0.05 mm and 0.01 mm lead to a less than 2% change in the peak stress. However, element sizes of 0.2 mm and 0.1 mm are too coarse to obtain reasonable results. The mesh independence was delivered by the four cases with local refinement in the fillet, for which the best element size can be fixed as 0.05 mm considering both computational costs and accuracy. Through the presented method in this study, we can obtain that \(K_{t}\) is 1.6 at the fillet of the supporting seat.

Stress distribution along the defined integral path
Moreover, numerous studies have indicated that the notch sensitivity coefficient \(q\) of AlMgSi family cast aluminum alloys (e.g., A356 and A357) is approximately 0.4–0.6 [26, 27], which shows a negative correlation with increasing casting shrinkage. Herein, q can be taken as 0.6 according to the experimental results of cast aluminum alloy A357-T6 in Ref. [27]. By substituting this value into Eq. (4), the effective stress concentration factor was calculated as \({K}_{f} = 1.36\). The characteristic size of the supporting seat was approximately 60 mm, and no secondary processing was conducted after casting. Referring to the mechanical design handbook [12], the size factor ε and surface factor β can be given as 0.7 and 0.8, respectively. In terms of Eq. (1), \({K}_{D}\) shows a negative correlation with increases in both ε and β. Conversely, it shows a positive correlation with \({K}_{f}\), which is the dominant value in Eq. (1). The fatigue strength reduction factor of the cast aluminum beam was calculated using Eq. (1), and its value was \(K_{D} = 2.45\).
5 Fatigue Characterization of the Cast Aluminum Beam
The stress concentration, structural size, and process factors should be considered to characterize the fatigue property of a large and complex structure. Fatigue fractures usually occur at geometric irregularities, for example, fillets and holes, where the stress concentration factor dominates the influence of fatigue damage. Moreover, the number of interior potential defects increases with the structural size; additionally, the manufacturing process (e.g., cast, machine, etc.) also affects the fatigue properties of a component or structure. Although the fatigue property of a certain material obtained from smooth benchmark specimens is insufficient to assess that of a structure, the material S–N curve should be modified considering these factors.
5.1 Fitting and Extrapolating on the S–N Curve of A357-T6
A constant slope S–N curve is usually used in North America, and is calculated using the root mean cube approach based on the equivalent stress range. Considering different ways of damage increase below the fatigue limit, European convention ECSS [28] and Swedish regulations BSK 99 [29] adopted a dual-slope expression referred to as the 2m–1 approach; it refers to beginning with a constant slope m, and turning with a slope of 2m–1 at the preliminary stage for a long life S–N curve. Beginning with \(5 \times 10^{6}\) cycles, the slope m of the S–N curve below the current stress level is taken over by a slope of 2m–1. This approach can effectively describe the dual-slope characteristics of the S–N curves of aluminum alloys [30]. The relationship between the stress and load cycles delivered by the Basquin model can be expressed as follows:
where m and C denote the material constants, S and N are the stress range and corresponding cycle index, respectively.
In Ref. [30], it is considered that small size surface defects (≤ 2 mm) and closed shrinkage defects (2.5–4.5 mm2) only have a relatively high influence on the low-cycle fatigue life of cast aluminum alloy A357-T6. However, this is no longer obvious when it comes to high-cycle fatigue issues for this material. It also provides fatigue test data from \(10^{4}\) up to \(10^{6}\) cycles for specimens with and without defects. According to the scatter data shown in Ref. [30], the parameters in Eq. (9) after linear fitting and the 2m–1 approach are calculated in this study, as presented in Table 2. It shows that the defects and stress ratio will affect m and C, which determine the slope and intersection point, respectively, with axes in the log-log plot. Both parameters show a negative relation to the casting defects and mean stress.
Figure 12 illustrates the fitted S–N curve (solid lines) based on experimental data and extrapolated S–N curves (dashed lines) considering different contributions under lower stress. The casting defects have a certain influence but do not significantly affect the fatigue life of A357-T6 under low-cycle fatigue loads. As the stress amplitude decreases, the influence induced by the small-size casting defects decreases gradually, and the curves tend to coincide. Generally, material defects lead to a reduction in the fatigue strength owing to crack propagation from these defects. Munoz’s study [31] explains the two superimposed curves, that is, more than 80% of the cracks lead to fracture initiation from the internal defects and propagate in vacuum. For this cast material, a slower crack growth rate was observed in vacuum, with the corresponding slightly changing m.

S–N curves of the cast aluminum alloy A357-T6, as obtained from experiments [30] with 2m–1 approach
Regarding the loading condition, when the stress ratio was R = 0.1, the fatigue limit (\(10^{7}\) cycles with/without defects) was approximately 102 MPa. Herein, the specimen is tension-tension, and the stress value is the maximum stress that corresponds to the current stress ratio. In the case of compression-tension, R = –1, the stress amplitude at the fatigue limit of the material (with defects) was 86 MPa. Regarding the pure tension-tension specimen with R = 0.1, the stress amplitude is 45.9 MPa, which is lower than that with R = –1. Therefore, curves with different stress ratios have different intersection points with axes. In this study, the fatigue properties of A357-T6 with small-sized defects (R = −1) were considered for the following analysis.
5.2 Modified S–N Curve of the Cast Aluminum Beam
Combining the material S–N curve obtained in Section 5.1 and the fatigue strength reduction factor \(K_{D}\) calculated in Section 4.3, the modified S–N curve of the beam is expressed by the following equation:
where \(m_{D}\) and \(C_{D}\) are the parameters of the structural S–N curve after modification using \(K_{D}\). Taking the logarithm on both sides of Eq. (10), we obtain
The structural S–N curve is also linear in log-log coordinates. Similarly, the 2m–1 approach at the turning index of \(5 \times 10^{6}\) cycles was implemented to calculate the parameters in the structural S–N curve. Therefore, the material S–N curve is corrected to obtain the stress-life relation of the structure as follows:
where \(S_{D}\) is the stress amplitude for the S–N of the structure, \(S\), and represents the stress amplitude in the material S–N curve.
Table 3 lists the parameters of the calculated S–N curves, and Figure 13 shows a comparison between the beam structure and material A357-T6. It can be observed that the structural S–N curve is parallel to that of the material S–N curve through the modification of \(K_{D}\). The modified stress at the turning index \(5 \times 10^{6}\) cycles was 37.0 MPa, and the extrapolated fatigue limit at \(10^{7}\) cycles was 35.4 MPa. For different families of aluminum alloys [32], when the cycle index is less than \(10^{6}\), the S–N curve of notched specimens is also parallel to that of unnotched specimens. However, for the latter with less linearity, the parameters N, m, and C in the Basquin model are insufficient to describe the fatigue property. This in turn affects the results of the modified structural S–N curve. However, the modification using \(K_{D}\) can only provide reasonable results when the material is not highly sensitive to the notch effect. Therefore, attention should be paid to the material properties when using this method.

Comparison of structural and material S–N curves, as obtained from modification with fatigue strength reduction factor
In this study, the calculated fatigue limit of the cast aluminum beam is 35.4 MPa, which is higher than the maximum stress (34.7 MPa) computed via the FE model. Additionally, considering the influence factors and 2m–1 approach, the modified S–N curve of the beam is relatively conservative compared to that calculated using the constant amplitude fatigue limit. This approach considers that the stress ranges below and above the constant amplitude fatigue limit do not contribute to the damage increase in the same way; however, the increasing crack rate and crack propagation are not considered. Moreover, no surface cracks were detected after ten million cycles of the fatigue test, and the FE analysis of the structure showed a low stress level, both of which illustrated that the cast aluminum beam yields a safety tolerance.
6 Conclusions
-
(1)
The presented method can be applied to both structured and unstructured grids. By selecting the cut-off point along the integral path via the criterion \(\nabla \sigma \to 0\), \(K_{t}\) is computed efficiently for complex structures, for which it is difficult to find an accurate cross-section. Any integral path can be addressed using interpolation instead of manually selecting the nodes. The method determined by the stress gradient is a net-section-based calculation, which can avoid dangerous results.
-
(2)
The FE model of the cast aluminum beam was established and validated using the experimental results. Under the cyclic load condition, the maximum stress was located in the fillet of the supporting seats. Ten million cycles were conducted in the fatigue test, and the results showed that no surface cracks were detected via LPT.
-
(3)
In the fillet of the supporting seats of the cast aluminum beam, the calculated \(K_{D}\) is approximately 2.45 in this study. The computed fatigue limit of the beam is 35.4 MPa through fitting and extrapolation of the material S–N curve, which is higher than the maximum stress of the simulation results. Both the simulation and experimental results indicate that the stress level of the entire structure is relatively low; thus, the beam can satisfy the requirement of service life.
References
M Zanetti, V Babini, G Meneghetti. Definition of nominal stress-based FAT classes of complex welded steel structures using the Peak Stress Method. Procedia Structural Integrity, 2019, 19: 627-636.
F Berto, A Campagnolo, P Lazzarin. Fatigue strength of severely notched specimens made of Ti–6Al–4V under multiaxial loading. Fatigue & Fracture of Engineering Materials & Structures, 2015, 38(5): 503-517.
A T Htoo, Y Miyashita, Y Otsuka, et al. Notch fatigue behavior of Ti-6Al-4V alloy in transition region between low and high cycle fatigue. International Journal of Fatigue, 2017, 95: 194-203.
J Hu, L Xie, R Zhang, et al. Failure analysis of a crack on a train bolster. Engineering Failure Analysis, 2019, 97: 32-42.
M Aristizabal, J L Barbosa, G R Betancur, et al. Structural diagnosis of rail vehicles and method for redesign. Diagnostyka, 2014, 15: 23-31.
Y Song, P Wu, L Jia. Study of the fatigue testing of a car body underframe for a high-speed train. Proceedings of the Institution of Mechanical Engineers, Part F: Journal of Rail and Rapid Transit, 2016, 230(6): 1614-1625.
S I Seo, C S Park, K H Kim, et al. Fatigue strength evaluation of the aluminum carbody of urban transit unit by large scale dynamic load test. JSME International Journal Series A Solid Mechanics and Material Engineering, 2005, 48(1): 27-34.
T Makino, T Kato, K Hirakawa. Review of the fatigue damage tolerance of high-speed railway axles in Japan. Engineering Fracture Mechanics, 2011, 78(5): 810-825.
Y X Zhao, H B Liu. Weibull modeling of the probabilistic S–N curves for rolling contact fatigue. International Journal of Fatigue, 2014, 66: 47-54.
S Liu, C Liu, Y Hu, et al. Fatigue life assessment of centrifugal compressor impeller based on FEA. Engineering Failure Analysis, 2016, 60: 383-390.
M Skorupa, T Machniewicz, A Skorupa, et al. Fatigue strength reduction factors at rivet holes for aircraft fuselage lap joints. International Journal of Fatigue, 2015, 80: 417-425.
J E Shigley. Shigley’s mechanical engineering design. Tata McGraw–Hill Education, 2018.
N G Cormier, B S Smallwood, G B Sinclair, et al. Aggressive submodelling of stress concentrations. International Journal for Numerical Methods in Engineering, 1999, 46(6): 889-909.
C Curreli, F Di Puccio, L Mattei. Application of the finite element submodeling technique in a single point contact and wear problem. International Journal for Numerical Methods in Engineering, 2018, 116(10-11): 708-722.
M Grasso, Y Xu, R Russo, et al. Mixed mode fatigue crack propagation behaviour of aluminium F357 alloy. Engineering Failure Analysis, 2018, 90: 463-475.
R Xiu, M Spiryagin, Q Wu, et al. Fatigue life assessment methods for railway vehicle bogie frames. Engineering Failure Analysis, 2020: 104725.
L W Tong, G W Xu, D L Yang, et al. Stress concentration factors in CHS-CFSHS T-joints: Experiments, FE analysis and formulae. Engineering Structures, 2017, 151: 406-421.
J Hu, L Xie, L Liu, et al. Structural safety evaluation of a subway bolster based on numerical simulation and experimental test. Journal of the Brazilian Society of Mechanical Sciences and Engineering, 2019, 41(1): 1-11.
L He, H Akebono, A Sugeta, et al. Cumulative fatigue damage of stress below the fatigue limit in weldment steel under block loading. Fatigue & Fracture of Engineering Materials & Structures, 2020, 43(7): 1419-1432.
M M Topac, S Ercan, N S Kuralay. Fatigue life prediction of a heavy vehicle steel wheel under radial loads by using finite element analysis. Engineering Failure Analysis, 2012, 20: 67-79.
Ö Karakaş, G Zhang, C M Sonsino. Critical distance approach for the fatigue strength assessment of magnesium welded joints in contrast to Neuber's effective stress method. International Journal of Fatigue, 2018, 112: 21-35.
R E Peterson. Notch sensitivity. Metal fatigue, 1959, 293-306.
R Zhou, W Hu, G Luo, et al. Quantum realization of the nearest neighbor value interpolation method for INEQR. Quantum Information Processing, 2018, 17(7): 1-37.
International Electrical Commission. Railway applications-Rolling stock equipment-Shock and vibration tests. IEC61373, 2010.
ASTM International. ASTM E165 - Standard Test Method for Liquid Penetrant Examination. West Conshohocken, 2012.
C M Sonsino, J Ziese. Fatigue strength and applications of cast aluminum alloys with different degrees of porosity. International Journal of Fatigue, 1993, 15(2): 75-84.
J Linder, M Axelsson, H Nilsson. The influence of porosity on the fatigue life for sand and permanent mould cast aluminium. International Journal of Fatigue, 2006, 28(12): 1752-1758.
ECCS, European convention for constructional steelwork: convention Europeenne de la construction metallique, 1976.
BSK 99, Swedish Regulations for Steel Structures. Boverkets Handbok Om Stalkonstructioner, Karlskrona, Sweden, 1999.
I S Munoz. Influence of casting defects on the fatigue behaviour of an A357-T6 aerospace alloy. Lyon: INSA, 2014.
I S Munoz, J Y Buffiere, C Verdu, et al. Influence of surface and internal casting defects on the fatigue behaviour of A357-T6 cast aluminium alloy. International Journal of Fatigue, 2016, 82: 361-370.
J A Bennett, J G Weinberg. Fatigue notch sensitivity of some aluminium alloys. Journal of research of the National Bureau of Standards, 1954, 52(5): 235-245.
Acknowledgements
The authors sincerely thank the China Academy of Railway Sciences (CARS) for supporting the necessary test conditions.
Funding
Supported by the National Natural Science Foundation of China (Grant No. 51475036) and the International Cooperation and Exchange of the National Natural Science Foundation of China (Grant No. 51711530034).
Author information
Authors and Affiliations
Contributions
WD wrote the manuscript and was in charge of the whole trial; LZ revised the manuscript; HC assisted review and editing; HZ and CL assisted with the fatigue test. All authors read and approved the final manuscript.
Authors’ Information
Weiyuan Dou, born in 1989, is currently a postdoctoral fellow at School of Mechanical, Electronic, and Control Engineering, Beijing Jiaotong University, China. His research interests include multi-field coupling and structural strength reliability.
Lele Zhang, born in 1973, is currently a professor at School of Mechanical, Electronic, and Control Engineering, Beijing Jiaotong University, China. Her research interests include passive safety and optimization design.
Haifeng Chang, born in 1996, is currently a master candidate at School of Mechanical, Electronic, and Control Engineering, Beijing Jiaotong University, China.
Haifeng Zhang, born in 1982, is currently a senior engineer at CRRC Changchun Railway Vehicles Co., Ltd., China.
Changqing Liu, born in 1975, is currently the chief engineer at CRRC Changchun Railway Vehicles Co., Ltd., China.
Corresponding author
Ethics declarations
Competing Interests
The authors declare no competing financial interests.
Rights and permissions
Open Access This article is licensed under a Creative Commons Attribution 4.0 International License, which permits use, sharing, adaptation, distribution and reproduction in any medium or format, as long as you give appropriate credit to the original author(s) and the source, provide a link to the Creative Commons licence, and indicate if changes were made. The images or other third party material in this article are included in the article's Creative Commons licence, unless indicated otherwise in a credit line to the material. If material is not included in the article's Creative Commons licence and your intended use is not permitted by statutory regulation or exceeds the permitted use, you will need to obtain permission directly from the copyright holder. To view a copy of this licence, visit http://creativecommons.org/licenses/by/4.0/.
About this article

Cite this article
Dou, W., Zhang, L., Chang, H. et al. Fatigue Characterization on a Cast Aluminum Beam of a High-Speed Train Through Numerical Simulation and Experiments. Chin. J. Mech. Eng. 34, 108 (2021). https://doi.org/10.1186/s10033-021-00628-6
Received:
Revised:
Accepted:
Published:
DOI: https://doi.org/10.1186/s10033-021-00628-6